On Career Paths and Gratitude

When someone asks me how I ended up in this tenure-track position in medical visualization, I often answer: “Well, I was very lucky! There are not many positions like this and I had exactly the right mixed background”. A new interdisciplinary center for Medical Imaging and Visualization (MMIV) was about to be established and this position came with it. While I don’t disagree with myself entirely, calling it luck does not completely cover it.

Some people might respond differently to this question entirely and say (or at least think): “I am just that good and worked hard to get here”. This is a ‘self-made man’-style sentiment that I do not subscribe to. One of my friends, who has also started writing great blog posts recently, recently said “We’re all products of our backgrounds…. There is only a tiny bit we bring to the table ourselves. Some. But definitely not all.”. This exactly reflects my view on this topic, we are presented with different opportunities and challenges based on the environments we grow up in. This brings me to my reason for disagreeing with myself calling it just luck. It is not respectful to the people that made this path possible for me in many ways.

I like this image a lot. However, I don’t think we all have equal opportunities and it is all up to us to shape our future. We are dealt a different cards from the very beginning and your environment also determines what is possible. I think the gray line, TODAY, is where we should focus most of our attention.

In this post, I would like to thank some of the people who made this particular career path possible for me. A risk of writing such posts is that you might forget to mention some and this could cause offense, but I would rather take this risk than never show gratitude at all. Sorry if I did not mention you! I am sure you were great as well 🙂

A supportive family

I grew up in a wonderful and loving family. My father worked as a lab analyst while my mother was a health care provider who took care of those that could no longer care for themselves. Both the precise and technical aspects of lab work and helping others ended up as a major inspiration for later career choices. Thanks to my dad’s passion for video games, we always had access to the latest computers. I started playing games with my dad and brother on the Commodore 64 when I was very young. Never once did I hear: ‘Oh games are not for girls, you are supposed to play with dolls’. I did not know of many in my family who went to University and there was certainly no one who had a PhD degree. Perhaps as a result of this, my parents never pressured me into getting top grades or picking certain career directions and only encouraged me by saying ‘you should do something you like doing’. I am so grateful for their support and exactly this encouragement.

A supportive study environment

When I was in elementary school, I had some sort of natural aptitude for math problems (unfortunately for me, this natural aptitude is currently missing in action :D). I was already finished with the math assignments way before others in my class. One of my teachers noticed and started giving me more math problems at higher difficulty levels so I would not be bored. She gave me the opportunity to do more of what I liked so much.

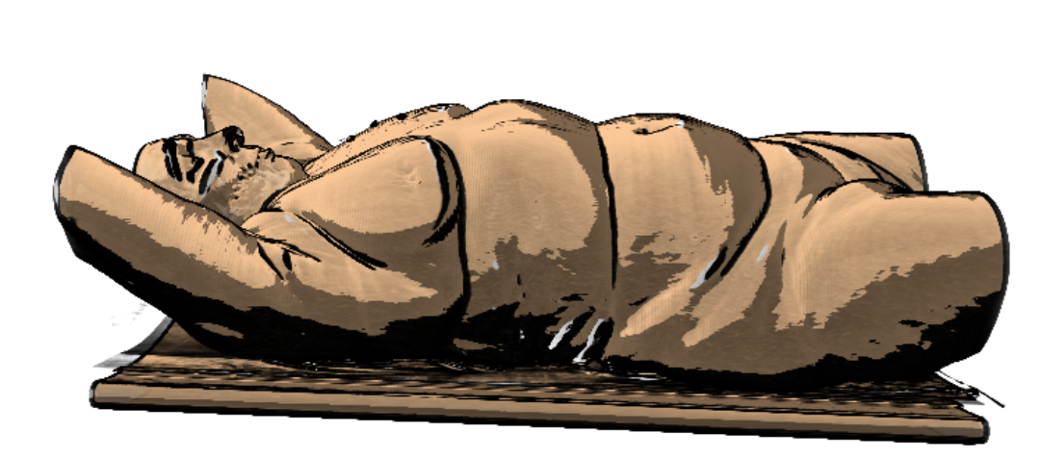
During high school, the open days at universities (a career path expected for students at Gymnasium high school level in the Netherlands) did not impress me at all. I remember ‘computer science’ in particular had something lame about databases as a demonstration of what the studies are about. I wanted to help people and thought of becoming a physical therapist. My dad took me to an open day at the local hospital and there we were also introduced to other professions. One of them was radiography. This job amazed me, they had all sorts of epic machines that allow people to look inside the human body. So I went to study and work as a radiographer for three years. I enjoyed it at the time, but realized I wanted to do more with the technical aspects of the job after some years. My supportive family and especially my partner encouraged me to quit a job I didn’t enjoy any longer and to study something I might enjoy instead. As I still loved gaming, I thought, why not computer science?

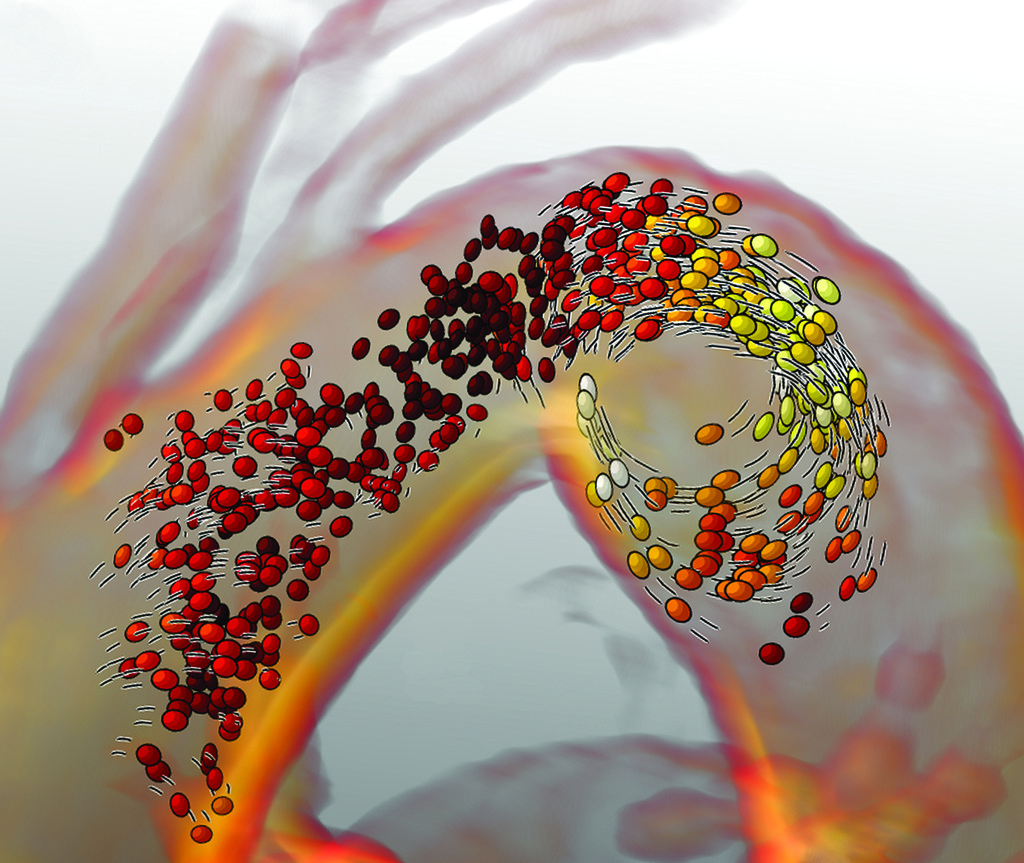
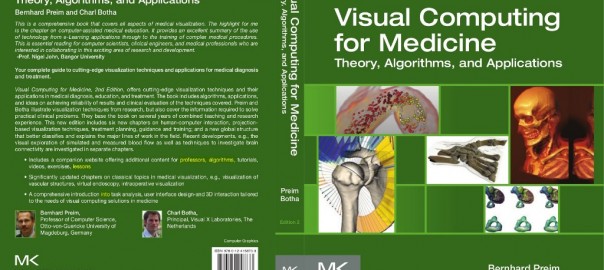
As I was gaming so much, at first I dreamed of becoming a game developer while studying computer sciences. However, on the university web pages when looking into computer graphics, I saw something called ‘medical visualization’. During my bachelor studies, I made an appointment with Charl Botha to see what that was about. He showed me super exciting research using a combination of computer graphics and the medical imaging data I had been on the producing end of in my previous job. This was clearly the best of both worlds! I happily did my bachelor thesis under Charl’s guidance and continued to specialize further in this area during my master’s. While a PhD position was certainly not something I was very aware of during my studies, I got a glimpse of this life while working with Charl on my master thesis project. I was fully convinced I was too stupid to do this sort of thing, but Charl patiently explained what type of skillset is needed to do a PhD and why I would be able to. If it was not for this particular encouragement and the position he had open, I would have never even considered it.

A supportive research environment

As a PhD candidate in the Netherlands, you are a paid employee with all benefits. This is a very good thing in my opinion. Especially as we didn’t have the financial means to support ourselves if this was not the case. Throughout my career as a PhD candidate, I again received excellent support from my environment. One example is all the advice and inspiration from my PhD advisors, which was not only limited to the research itself. Also my colleagues and collaborators were graciously sharing their experiences, their networks, and their time.

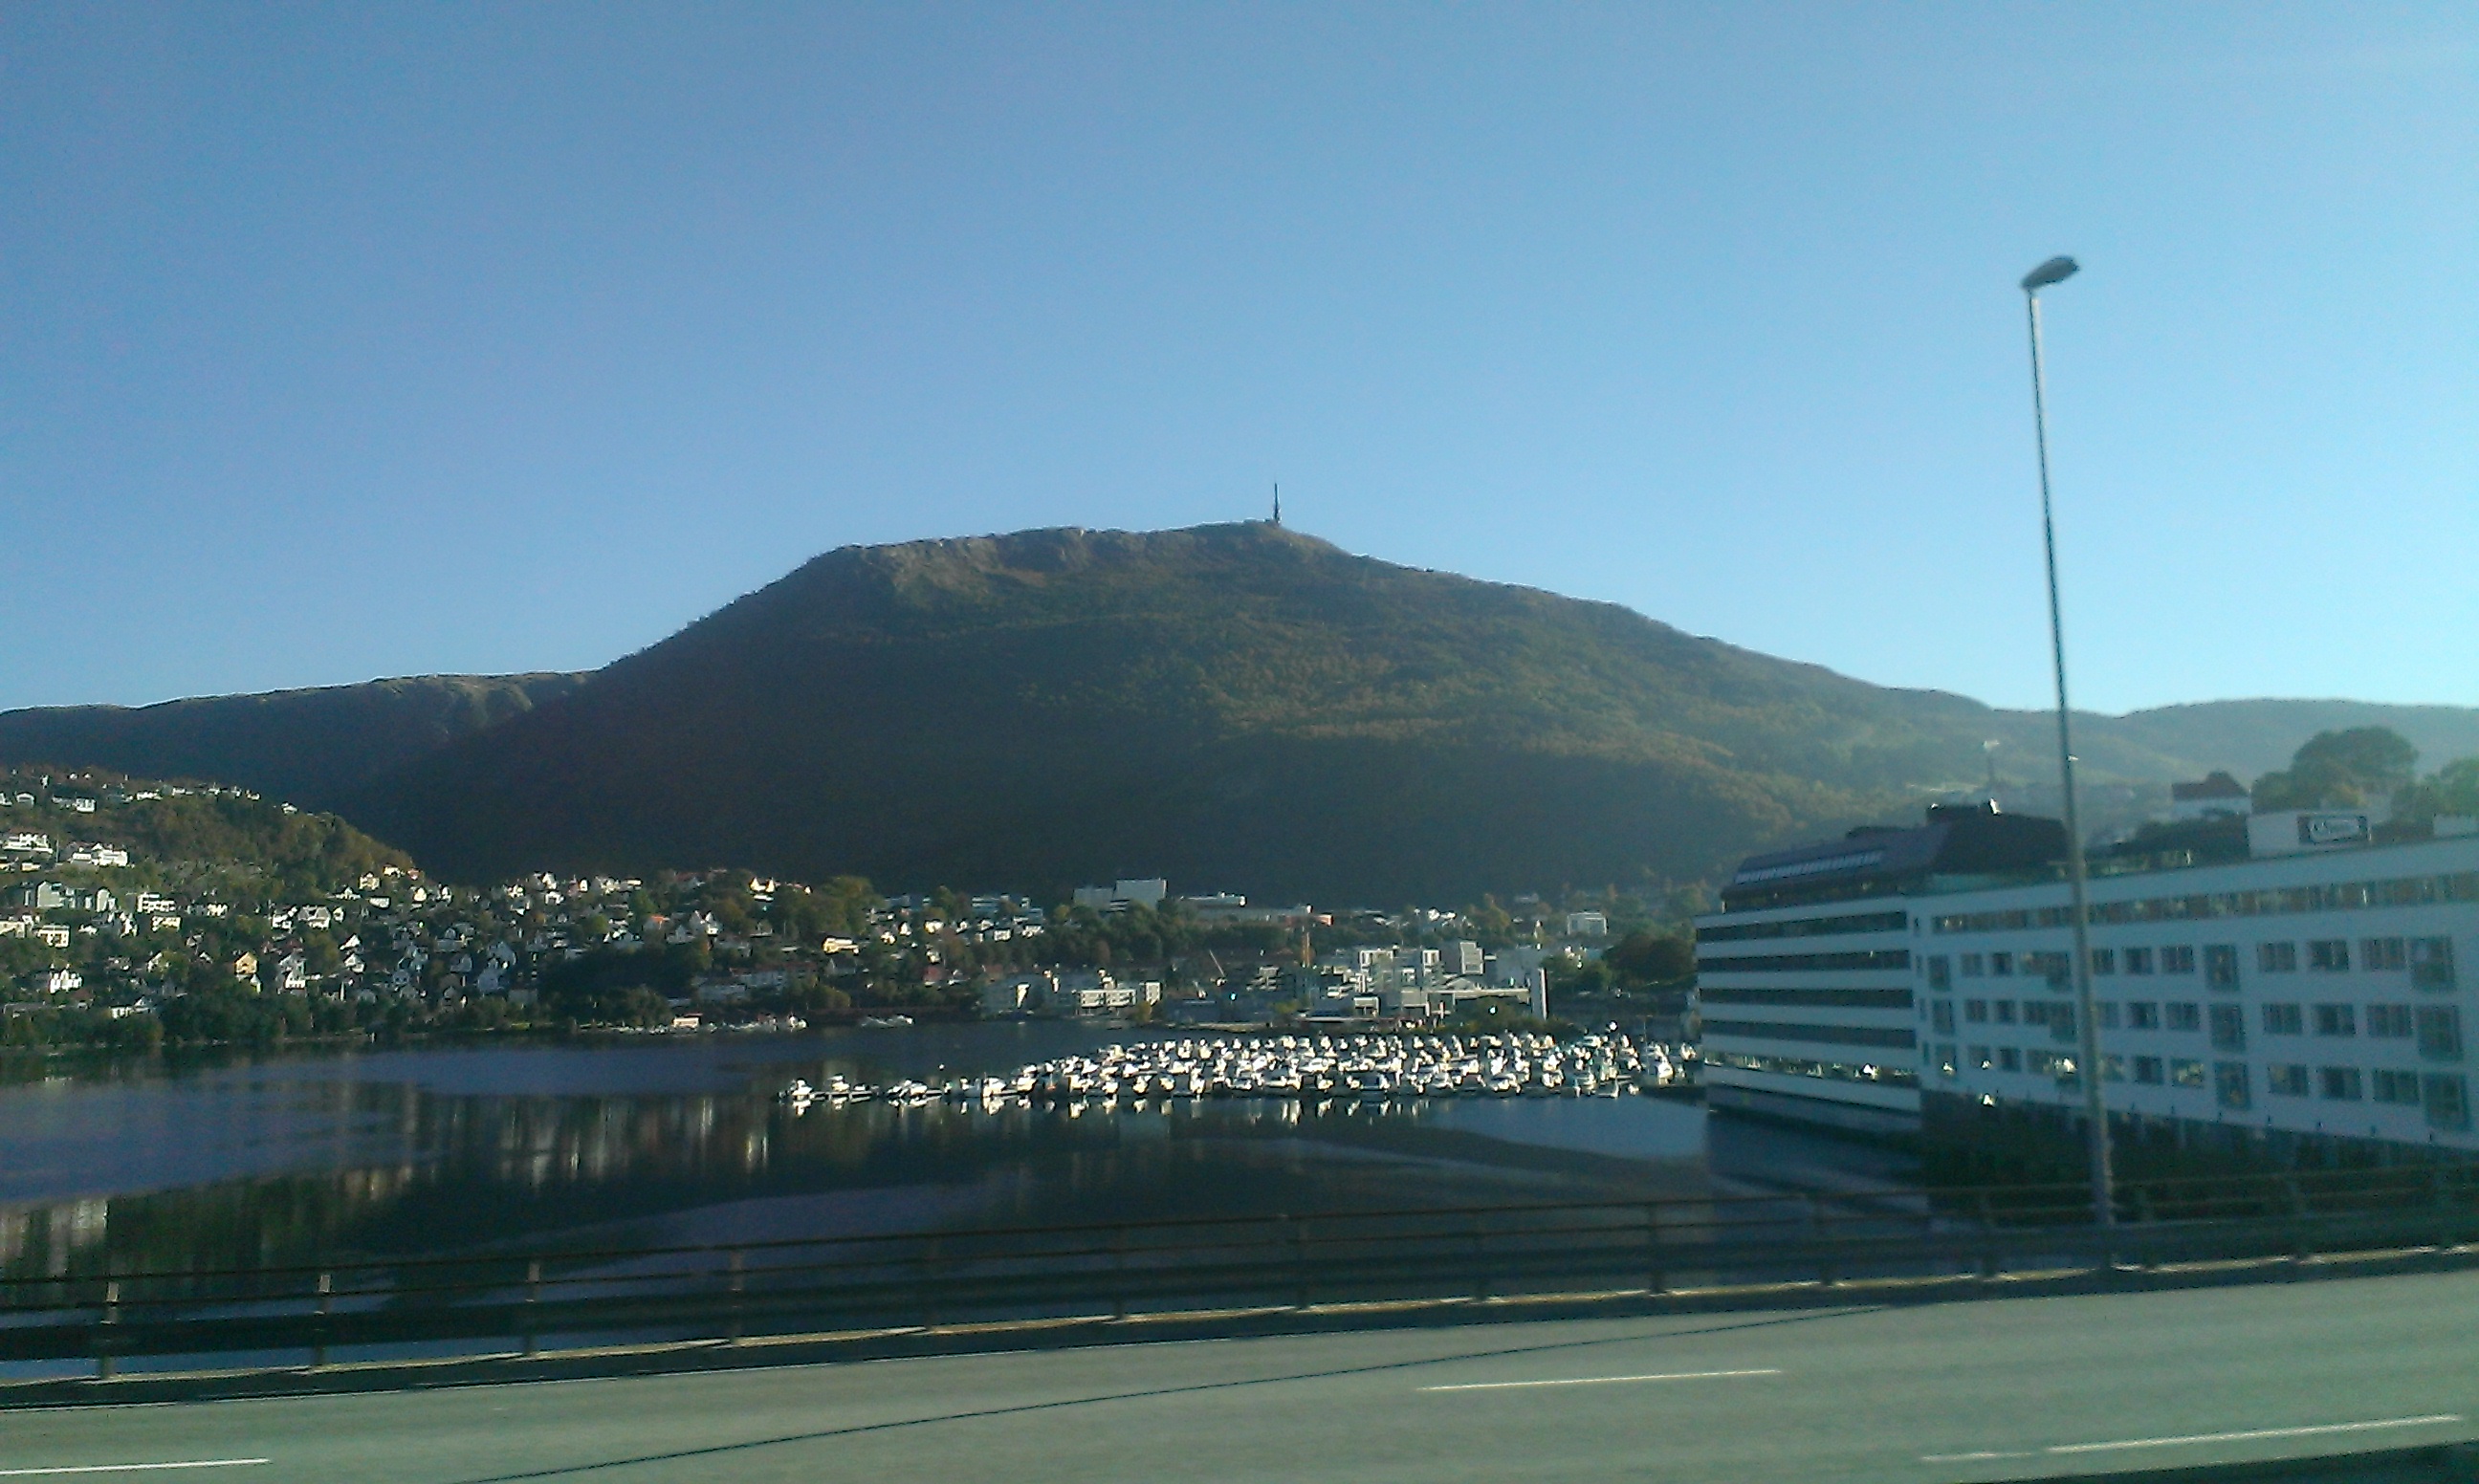
As I mentioned before, the tenure-track position I have came with the establishment of a new interdisciplinary research center. This center was established based on a lot of hard work from people in Bergen over many years in the MedViz initiative. This in turn provided perfect conditions for an exciting interdisciplinary research environment to thrive. I am so grateful to everyone here who has worked on making this happen and those that gave me a chance in this position. I am literally in the place of my dreams, an environment where people of different backgrounds collaborate on developing technology that helps people.

The longer answer

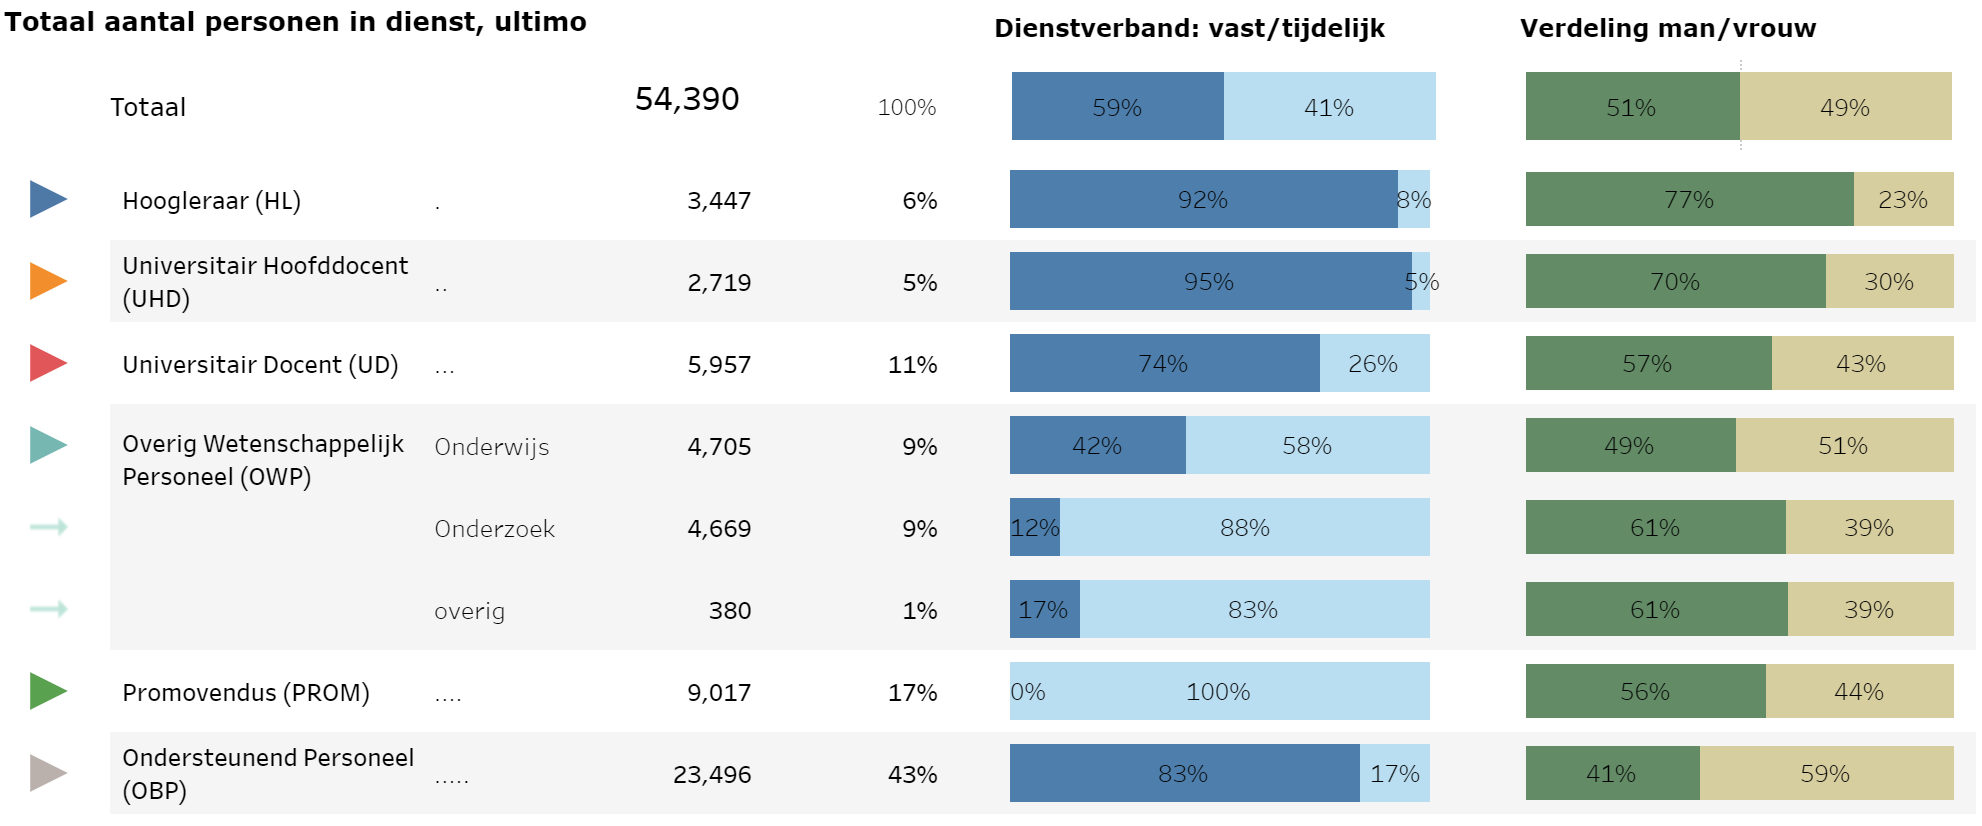
Coming back to my original answer. I still believe luck is a large component in landing the job I did. The academic job market is shaped like a pyramid with very little room at the top.

The academic positions pyramid scheme. Note that this is a conceptual representation only, I think the actual numbers at the top are much smaller than this shape suggests. Also, as Norway does not seem to do the assistant prof. thing, I totally skipped a step.

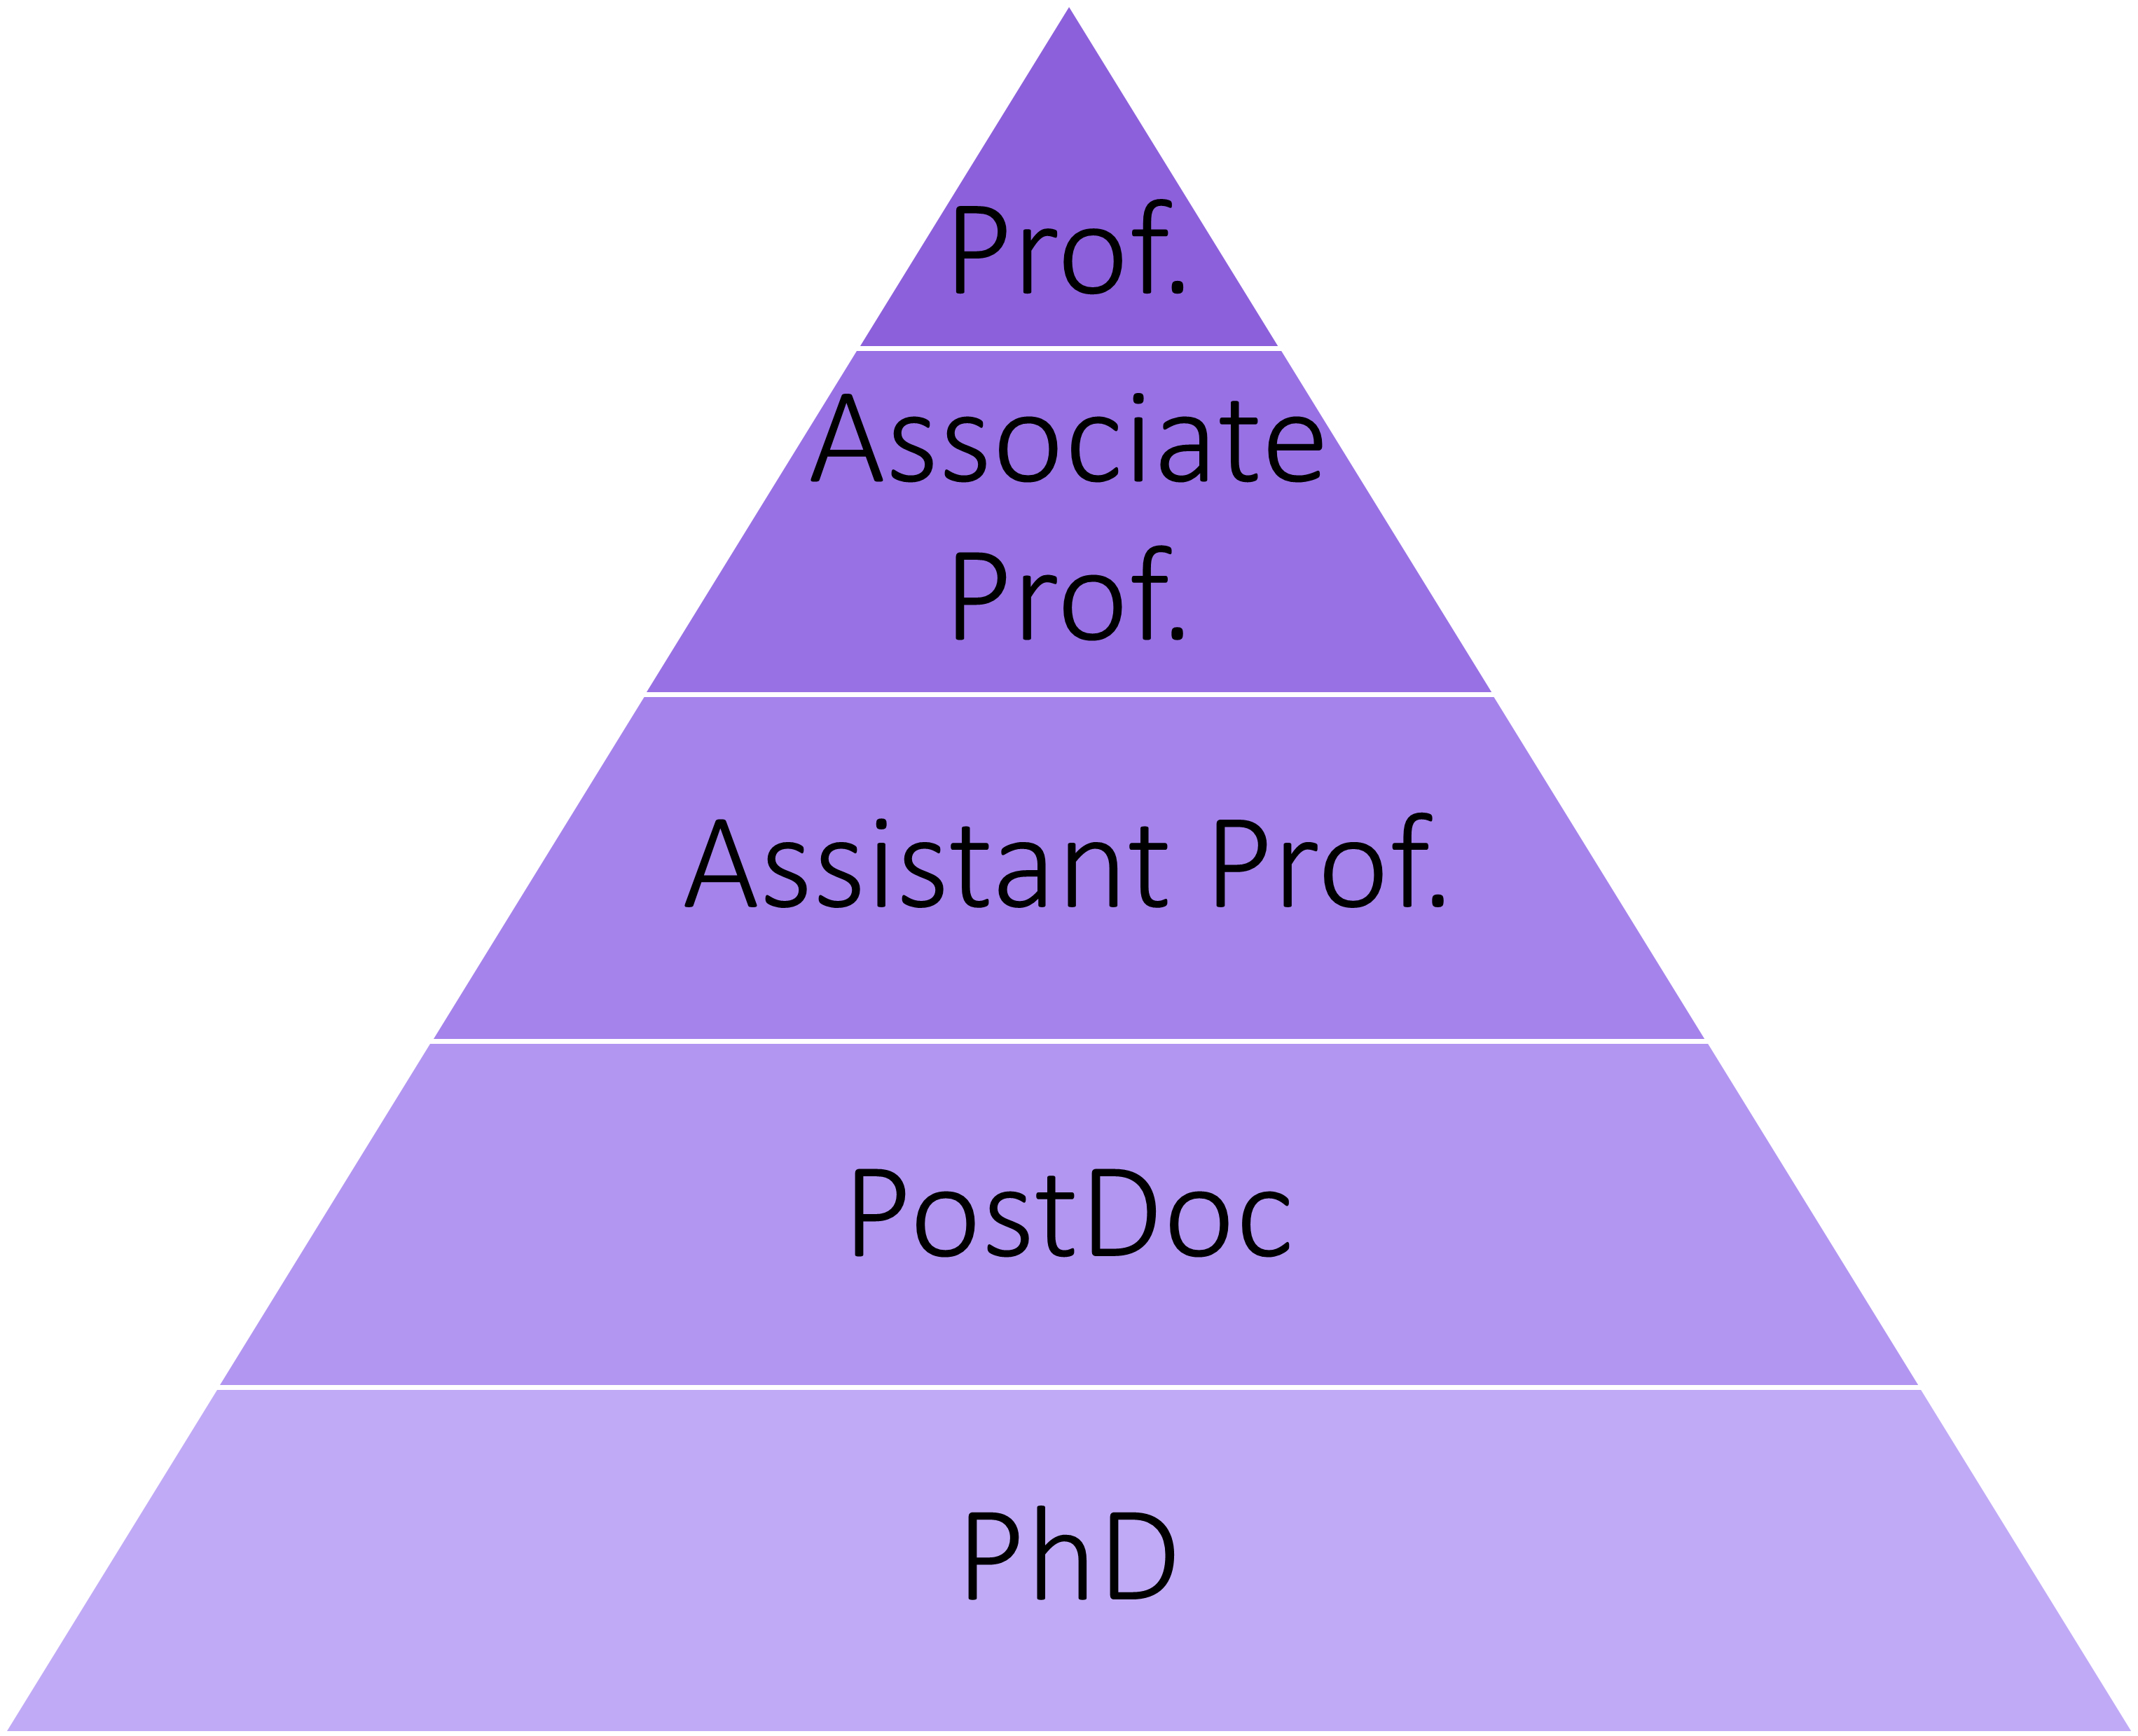
Just looking at the sheer number of positions, only very few will have the opportunity to achieve tenure. There simply are not enough positions to make everyone who has put in the hard work and would qualify an offer. This sucks and I think we should be aware of these odds from the very beginning. As advisors, we should highlight non-academic career paths post-PhD as they can be just as rewarding (if not more :D).

The total numbers of employees and percentages at Dutch universities in 2019 (screenshot from interactive VSNU page). 3447 people (6%) were hoogleraar (professor), 92% of those in a permanent position. 9017 people (17%) were promovendi (PhD candidates), 100% in temporary positions. Don’t get me started on the leaky pipeline in terms of gender ratios shown on the right.

It is also important to acknowledge privilege. I had access to things growing up that made my career possible. For example, the computers in our home allowed me to build computer skills and interest from an early age. Many families do not have the financial means to support this or to support the ‘do what makes you happy’ career advice. I was lucky to join a research team with a great reputation internationally in my field and to have access to everything I needed. I try to pay it forward as much as I can.

Note the survivorship bias when considering who has tenured positions and trying to figure out what properties lead to success. While I would love to hand out the ‘Ten Hot Tips on How to Get a Tenure-Track Position – Number Five will Blow your Mind!’-clickbait, I cannot. I still believe a large component is luck and randomness. The luck is not only in available positions and background, but very much in having the right environment from the very beginning and along the way.

This post is the longer answer to the original question: “Well, I was very lucky to be born in the right supportive family, receive excellent support in my school years and meet many amazing people along the way! There are not many positions like this and I had exactly the right mixed background, thanks to the support of everyone around me.“. Thanks everyone! Also to those who inspired this blog post, you know who you are 🙂

Updated web page!

I finally took some time to update this website to hopefully showcase a bit more what I’ve recently been up to and what I’m currently working on. It was very much still focused on my PhD, since this was also the time I was last actively blogging. With this update, I am giving more of a thorough overview of all the things you’re expected to be awesome at in a tenure-track position.

Updating all this made me a little nostalgic for blogging actually. I have several thoughts about this:

  • Blogging is so 2016, I should just have an up-to-date web page and that’s fine!
  • I could totally write blogs about my first experience with virtual conference attendance last week, lessons learnt from my mid-term tenure-track evaluation, a EuroVis 2020 conference report focusing on medvis highlights…

It could really go either way!

Published
Categorized as General

Updated my Publications Page

In a small attempt at blowing away the cobwebs in this website, I have updated my Publications page. I switched from manual updates (*shudder*) to the Papercite plug-in, which updates from a bibtex file stored in my Dropbox. I am in the process of adding PDF files for every single publication, and experiencing the joys of wading through publisher regulations to check what their conditions are for sharing post-prints.

In this regard, SHERPA/RoMEO has been very helpful. You simply look for a specific journal and see what they allow. For example, the Computers & Graphics journal published by Elsevier places a 24-month embargo on putting your post-print on open access repositories and institutional pages, but does allow author’s to put the accepted manuscript on their personal website or blog immediately. Yay for having a blog!

So here is a blog-exclusive, the PDF of our accepted paper ‘Real-time Field Aligned Stripe Patterns'[1] is now hosted on this very website! Another recent publication that I may have failed to mention here so far is our Survey on Multimodal Medical Visualization[2].

[1] [doi] N. Lichtenberg, N. Smit, C. Hansen, and K. Lawonn, “Real-time field aligned stripe patterns,” Computers & Graphics, vol. 74, p. 137–149, 2018.
[Bibtex]
@article{lichtenberg_real-time_2018,
title = {Real-time field aligned stripe patterns},
volume = {74},
issn = {0097-8493},
url = {http://noeskasmit.com/wp-content/uploads/2018/08/lichtenberg_2018.pdf},
doi = {10.1016/j.cag.2018.04.008},
abstract = {In this paper, we present a parameterization technique that can be applied to surface meshes in real-time without time-consuming preprocessing steps. The parameterization is suitable for the display of (un-)oriented patterns and texture patches, and to sample a surface in a periodic fashion. The method is inspired by existing work that solves a global optimization problem to generate a continuous stripe pattern on the surface, from which texture coordinates can be derived. We propose a local optimization approach that is suitable for parallel execution on the GPU, which drastically reduces computation time. With this, we achieve on-the-fly texturing of 3D, medium-sized (up to 70 k vertices) surface meshes. The algorithm takes a tangent vector field as input and aligns the texture coordinates to it. Our technique achieves real-time parameterization of the surface meshes by employing a parallelizable local search algorithm that converges to a local minimum in a few iterations. The calculation in real-time allows for live parameter updates and determination of varying texture coordinates. Furthermore, the method can handle non-manifold meshes. The technique is useful in various applications, e.g., biomedical visualization and flow visualization. We highlight our method{\textquoteright}s potential by providing usage scenarios for several applications.},
urldate = {2018-07-29},
journal = {{Computers \& Graphics}},
author = {Lichtenberg, Nils and Smit, Noeska and Hansen, Christian and Lawonn, Kai},
month = aug,
year = {2018},
keywords = {Computational geometry,, Computer graphics, Parameterization, Visualization},
pages = {137--149},
}
[2] [doi] K. Lawonn, N. Smit, K. Bühler, and B. Preim, “A Survey on Multimodal Medical Data Visualization,” Computer Graphics Forum, 2017.
[Bibtex]
@article{lawonn_survey_2017,
title = {A {Survey} on {Multimodal} {Medical} {Data} {Visualization}},
doi = {10.1111/cgf.13306},
journal = {{Computer Graphics Forum}},
author = {Lawonn, Kai and Smit, Noeska and B{\"u}hler, Katja and Preim, Bernhard},
abstract = {Multimodal data of the complex human anatomy contain a wealth of information. To visualize and explore such data, techniques
for emphasizing important structures and controlling visibility are essential. Such fused overview visualizations guide
physicians to suspicious regions to be analyzed in detail, e.g. with slice-based viewing. We give an overview of state of the art
in multimodal medical data visualization techniques. Multimodal medical data consists of multiple scans of the same subject
using various acquisition methods, often combining multiple complimentary types of information. Three-dimensional visualization
techniques for multimodal medical data can be used in diagnosis, treatment planning, doctor-patient communication
as well as interdisciplinary communication. Over the years, multiple techniques have been developed in order to cope with
the various associated challenges and present the relevant information from multiple sources in an insightful way. We present
an overview of these techniques and analyze the specific challenges that arise in multimodal data visualization and how recent
works aimed to solve these, often using smart visibility techniques. We provide a taxonomy of these multimodal visualization applications
based on the modalities used and the visualization techniques employed. Additionally, we identify unsolved problems
as potential future research directions.
},
month = oct,
year = {2017},
url = {https://vis.uib.no/wp-content/papercite-data/pdfs/LawonnSmit-2017-MULTI.pdf}
}

Coursera course on anatomy of the abdomen and pelvis

I recently mentioned a certain OAH webviewer short paper that was accepted as a EuroGraphics Education paper, but I now have some more news to share: the webviewer will be used in a Coursera course on anatomy of the abdomen and pelvis that starts this week, entitled ‘Anatomy of the Abdomen and Pelvis; a journey from basis to clinic.’! This course is a Massive Open Online Course (MOOC), a free online course aimed at unlimited participation, and organized by highly qualified people at the Leiden University Medical Center.

So far, already 7,796 people signed up. If you also have an interest in anatomy, why not sign up yourself? It’s completely free and completely awesome, I promise! I do have to add, it is not for the faint of heart, since it features live anatomical dissection videos. I am following the course myself and really enjoying the classes. I even just passed my first quiz with 100% correct answers. Try and beat that 😉

Soon, you could be playing around with this yourself:

Looking forward to seeing you as my virtual classmates in the course 🙂

Comic Book-Inspired Illustrative Medical Visualization

Medical visualization isn’t always about rendering data in the most realistic way possible. In fact, quite often it isn’t. Illustrative rendering techniques have been developed that present medical data to the viewer in a style that is more abstract, often emphasizing important features, while taking emphasis away from the less relevant. Illustrative rendering techniques can even make data originating from medical imaging scanners such as CT, look hand-drawn. Check out for instance the works by Tobias Isenberg, Stefan Bruckner, Ivan Viola and Kai Lawonn to name a few. As you may recall, last year’s VCBM paper I had the pleasure of co-authoring also involved illustrative rendering:

Illustrative rendering of a CT scan

So what you see here kind of looks like a sketch hinting at the shape of the human body on a table right (well with some limbs missing ;))? Actually it’s a rendering of a CT scan combining toon shading and feature lines without any artists involved. Here’s another example by Roy van Pelt:

Roy van Pelt's blood flow visualization
Roy van Pelt’s blood flow visualization

He visualized blood flow using particles that get elongated as they move faster in combination with speed lines indicating the direction and speed of the particles. This style is reminiscent of something you could see in comic books or cartoons. In fact, I think there is a lot we can learn from comic book artists that we can apply to medical visualization.

For this reason, I asked Gerrit Rijken, AKA Iosua, a freelance illustrator as well as comic book aficionado, to write about the basics of inking, and more specifically the do’s and don’t’s and why’s of it all. In his elaborate post, which you can find here, he talks us through many things that are of interest in illustrative rendering as well. He describes how inking techniques are applied to create textures, the importance of line weights, spotting blacks, screen tones, feathering and cross-hatching. He provides explanations of these techniques combined with examples illustrating the concepts.

I see many parallels to visualizing techniques. For instance, focus-and-context techniques and depth cues are relevant for both comic books and medical visualizations. There are also some interesting rules on line thickness that I had not considered before. Furthermore I see techniques that have already been adopted in medical illustrative rendering, such as stippling and hatching, while I did not see researchers using feathering yet (correct me if I’m wrong ^^). I hope you find this as interesting as I did and if you have further questions, do not hesitate to contact him!

On Research Visits, Paper Writing and Club Mate

First up: a little In Memoriam for The ‘Weekly Status Update’. Remember those? I vaguely recall wanting to post weekly updates with five bullet points each. Ain’t nobody got time for that! I’m following up on excellent advice by cpbotha:  “when under-achieving, lower your standards”. I’m no longer setting any expectations here, I just post whenever I want, whatever I want from now on. So what’s cooking?

  • Last week I briefly visited the University of Koblenz · Landau, in, you guessed it, Koblenz to work on a EuroVis STAR paper (time to shine) with the newly minted J.- PROF. DR. KAI LAWONN, who you may remember from:
  • I’m currently visiting Bernhard Preim‘s excellent visualization group in Magdeburg to:
    • Meet the lovely group members
    • Work on the aforementioned paper (deadline: 14th of February, I can’t even…)
    • Oh and I also gave a talk last week. It was all over the news ;), but in case you missed it, check the group website
  • We are writing the aforementioned paper in Overleaf. Which is pretty awesome. I might do a little comparison post on ShareLatex vs. Overleaf when deadline season is over (estimated timeframe: never).
  • I’m getting a notification for a EuroGraphics Education paper I submitted next week on Monday. Will this end my paper rejection streak? Time will tell 🙂
  • I should probably get back to, oh writing a paper or two, but I’ll leave you with a nice action photo:

Club Mate
Drinking Club Mate and writing a paper. Kind of a big deal!

I didn’t realize when I bought it, but apparently, Club Mate is/was totally the hacker tech-startup drink of choice and I am now officially totally cool for drinking that.

Did I just write out five bullet points? Is this a Weekly Status Update in disguise?

2016 is here! A time for looking back and looking forward.

If cpbotha can post after a four month hiatus, then so can I ^^.  First of all, all the best for 2016 to all of you! I hope it’s a good one.  The start of a new year is as good a time as any (if not better) for a look back, or review if you want to get fancy about it, of the previous year and to look forward to things happening in the time ahead.

First up, looking back:

  • I didn’t blog so much, because a) I was crazy busy (final year of the PhD anyone?), and b) personal issues that I will not discuss here. Maybe I will increase the update frequency, maybe I won’t. Wait and find out?
  • In September, I presented at VCBM! My favorite conference in the world (eat it, VIS!). It was in Chester, UK this year (full report here) and I presented work festively entitled “Illustrative Multi-volume Rendering for PET/CT Scans”, which does exactly whatever you think it does. To make sure it does, check the full paper and pretty pictures here.
  • In September/October I went on a month-long research visit to the Bergen Visualization group in Norway, which was great for several reasons:
    • I met soooo many cool new people as well as cool people I knew from conferences before. It’s really an excellent group in all ways possible.
    • Bergen itself is really heaven on earth. It has it all, mountains within walking distance, a harbor, waffles and lots of metal. Also, VCBM 2016!
    • A little more on these mountains…. I’m not much of a sporty person, but on my first weekend there, I was invited to hike up Ulriken (only the highest of the Seven Mountains they have, luckily):

      Ulriken Bergen
      Ulriken as viewed from the airport bus

      Talk about life-changing experiences… Mind=blown by the view, experience and sheer exhaustion.

      View from Ulriken, Bergen
      View from Ulriken, Bergen. Hi, Bergen!

      It’s quite addictive really. I hiked up there once more during my stay. I could definitely see that becoming sort of just a thing to do on the weekends while living there.

    • I presented at a medviz seminar, check the flyer here. Yes, there was a flyer with my face on it!
    • I got some great PhD advice and started collaborating on a paper together. I can really recommend a visit like this, if it is at all possible, to anyone doing a PhD.
  • 2015 was definitely the year of collaborations. Good ones too (for me at least ^^)! I worked with people from Leiden, Magdeburg, Bergen and recently Koblenz, and they are all awesome and I hope to do more of that in 2016.

Then for the looking forward bit:

  • I hope to have more awesome collaborations in 2016.
  • I have approximately a million, ok four-ish, papers to wrap up and then…
  • I don’t want to alarm you or anything, but 2016 could be the year I get my PhD (correction sent in by cpbotha: get doctorified) . After which I’ll have to change the subtitle of this blog into something yet unknown. I’m not the world’s biggest fan of change, but let’s just say, ‘it is time’. I’ve been walking around at the TU Delft since 2005 (yes, really…), first as a bachelor student, then master, then PhD, and a decade is more than enough for me. I’m looking forward to starting something new somewhere else. Anywhere else 😉

Alright, I just spent my full two week holiday working interspersed with family visits, the first part of which is not really my style, but hey, desperate times, desperate measures. So I guess I’d better go finish 1 out of those million papers. Till next time!

Summer blog break!

Summer blog break!

I have good news and bad news. The good news is that I have two weeks off from work starting today, the bad news is that a) this week nothing happened that should be in a weekly status update and b) I will go on a blogging hiatus during my summer break. See you on the other side!

How scientific conferences are like music festivals

Fresh out of the nightly brainfart department, a short look at the similarities between scientific conferences and music festivals as well as some tips and tricks that apply to both:

  • The bigger conferences often feature parallel sessions not unlike how music festivals can have multiple stages and concerts at the same time.

    Tip:  Take a look at the schedule beforehand and choose the talks/concerts you really must see beforehand, so you don’t miss out on anything important during the event.

  • The keynote speakers are like the headliners at a festival: big names in the field who are allowed more time to present their work.

    Tip: Keynotes and headline shows got that spot for a reason, while there are exceptions, in general you can expect high quality content and good delivery, so be sure to attend.

  • Big conferences and festivals can span multiple action-packed days and therefore be really exhausting.

    Tip: Eat and drink well to maintain your energy levels and just hang in there. Big conferences/festivals only come around once a year and you might not get the chance to go every year, so make the most of your time there!