Updated my Publications Page

In a small attempt at blowing away the cobwebs in this website, I have updated my Publications page. I switched from manual updates (*shudder*) to the Papercite plug-in, which updates from a bibtex file stored in my Dropbox. I am in the process of adding PDF files for every single publication, and experiencing the joys of wading through publisher regulations to check what their conditions are for sharing post-prints.

In this regard, SHERPA/RoMEO has been very helpful. You simply look for a specific journal and see what they allow. For example, the Computers & Graphics journal published by Elsevier places a 24-month embargo on putting your post-print on open access repositories and institutional pages, but does allow author’s to put the accepted manuscript on their personal website or blog immediately. Yay for having a blog!

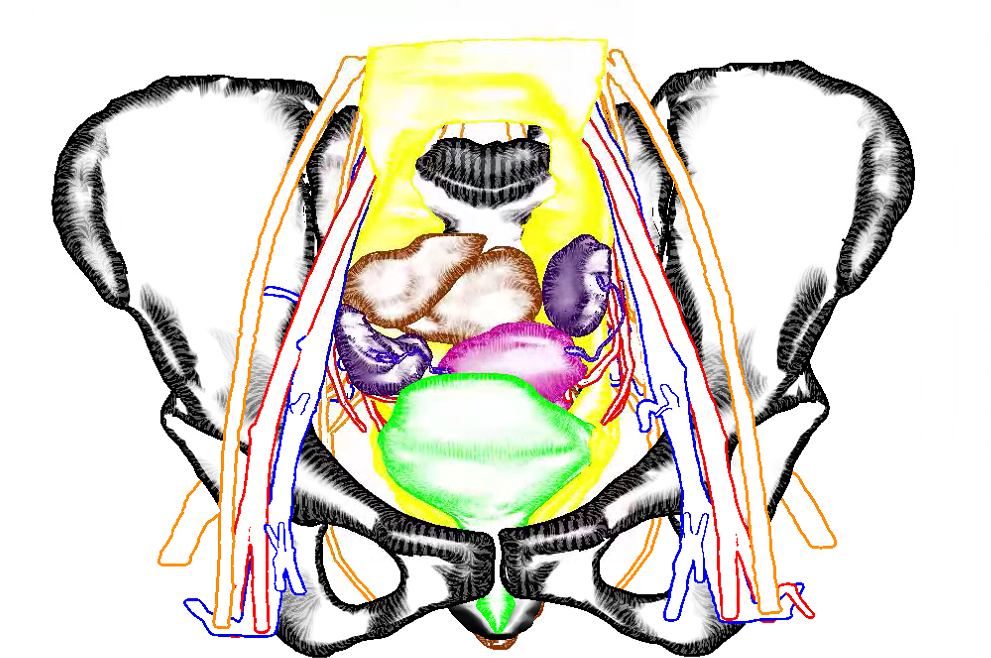
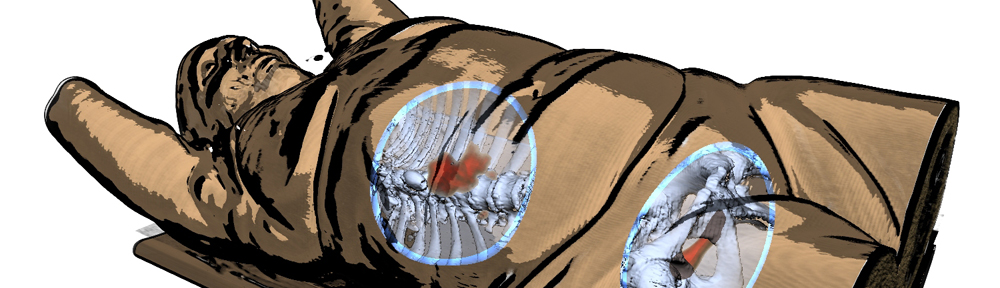
So here is a blog-exclusive, the PDF of our accepted paper ‘Real-time Field Aligned Stripe Patterns'[1] is now hosted on this very website! Another recent publication that I may have failed to mention here so far is our Survey on Multimodal Medical Visualization[2].

[1] [doi] N. Lichtenberg, N. Smit, C. Hansen, and K. Lawonn, “Real-time field aligned stripe patterns,” Computers & Graphics, vol. 74, p. 137–149, 2018.
[Bibtex]
@article{lichtenberg_real-time_2018,
title = {Real-time field aligned stripe patterns},
volume = {74},
issn = {0097-8493},
url = {http://noeskasmit.com/wp-content/uploads/2018/08/lichtenberg_2018.pdf},
doi = {10.1016/j.cag.2018.04.008},
abstract = {In this paper, we present a parameterization technique that can be applied to surface meshes in real-time without time-consuming preprocessing steps. The parameterization is suitable for the display of (un-)oriented patterns and texture patches, and to sample a surface in a periodic fashion. The method is inspired by existing work that solves a global optimization problem to generate a continuous stripe pattern on the surface, from which texture coordinates can be derived. We propose a local optimization approach that is suitable for parallel execution on the GPU, which drastically reduces computation time. With this, we achieve on-the-fly texturing of 3D, medium-sized (up to 70 k vertices) surface meshes. The algorithm takes a tangent vector field as input and aligns the texture coordinates to it. Our technique achieves real-time parameterization of the surface meshes by employing a parallelizable local search algorithm that converges to a local minimum in a few iterations. The calculation in real-time allows for live parameter updates and determination of varying texture coordinates. Furthermore, the method can handle non-manifold meshes. The technique is useful in various applications, e.g., biomedical visualization and flow visualization. We highlight our method{\textquoteright}s potential by providing usage scenarios for several applications.},
urldate = {2018-07-29},
journal = {{Computers \& Graphics}},
author = {Lichtenberg, Nils and Smit, Noeska and Hansen, Christian and Lawonn, Kai},
month = aug,
year = {2018},
keywords = {Computational geometry,, Computer graphics, Parameterization, Visualization},
pages = {137--149},
}
[2] [doi] K. Lawonn, N. Smit, K. Bühler, and B. Preim, “A Survey on Multimodal Medical Data Visualization,” Computer Graphics Forum, 2017.
[Bibtex]
@article{lawonn_survey_2017,
title = {A {Survey} on {Multimodal} {Medical} {Data} {Visualization}},
doi = {10.1111/cgf.13306},
journal = {{Computer Graphics Forum}},
author = {Lawonn, Kai and Smit, Noeska and B{\"u}hler, Katja and Preim, Bernhard},
abstract = {Multimodal data of the complex human anatomy contain a wealth of information. To visualize and explore such data, techniques
for emphasizing important structures and controlling visibility are essential. Such fused overview visualizations guide
physicians to suspicious regions to be analyzed in detail, e.g. with slice-based viewing. We give an overview of state of the art
in multimodal medical data visualization techniques. Multimodal medical data consists of multiple scans of the same subject
using various acquisition methods, often combining multiple complimentary types of information. Three-dimensional visualization
techniques for multimodal medical data can be used in diagnosis, treatment planning, doctor-patient communication
as well as interdisciplinary communication. Over the years, multiple techniques have been developed in order to cope with
the various associated challenges and present the relevant information from multiple sources in an insightful way. We present
an overview of these techniques and analyze the specific challenges that arise in multimodal data visualization and how recent
works aimed to solve these, often using smart visibility techniques. We provide a taxonomy of these multimodal visualization applications
based on the modalities used and the visualization techniques employed. Additionally, we identify unsolved problems
as potential future research directions.
},
month = oct,
year = {2017},
url = {https://vis.uib.no/wp-content/papercite-data/pdfs/LawonnSmit-2017-MULTI.pdf}
}

VCBM 2016 paper ‘Sline: Seamless Line Illustration for Interactive Biomedical Visualization’ accepted!

Our paper ‘ Sline: Seamless Line Illustration for Interactive Biomedical Visualization’ was accepted for presentation at VCBM 2016, the 6th Eurographics Workshop on Visual Computing for Biology and Medicine. I’ve attended all VCBM editions since 2012, and am happy I can attend this one as well in Bergen, Norway. Which is extra convenient, since it’s my new hometown! I accepted a position as a researcher in the amazing visualization group at the University of Bergen and just started this week ^^

Back to Sline though, it’s a cool technique where you can pick an illustrative rendering style per structure using a single parameter slider. Behold:

Our Virtual Surgical Pelvis illustrated using Sline
Our Virtual Surgical Pelvis illustrated using Sline. So the organs and bones are hatched to draw attention here, while the nerves and vessels are de-emphasized by rendering only the silhouettes.

authors:  Nils Lichtenberg, Noeska Smit, Christian Hansen, and Kai Lawonn

abstract: In medical visualization of surface information, problems often arise when visualizing several overlapping structures simultaneously. There is a trade-off between visualizing multiple structures in a detailed way and limiting visual clutter, in order to allow users to focus on the main structures. Illustrative visualization techniques can help alleviate these problems by defining a level of abstraction per structure. However, clinical uptake of these advanced visualization techniques so far has been limited due to the complex parameter settings required.

To bring advanced medical visualization closer to clinical application, we propose a novel illustrative technique that offers a seamless transition between various levels of abstraction and detail. Using a single comprehensive parameter, users are able to quickly define a visual representation per structure that fits the visualization requirements for focus and context structures. This technique can be applied to any biomedical context in which multiple surfaces are routinely visualized, such as neurosurgery, radiotherapy planning or drug design. Additionally, we introduce a novel hatching technique, that runs in real-time and does not require texture coordinates. An informal evaluation with experts from different biomedical domains reveals that our technique allows users to design focus-and-context visualizations in a fast and intuitive manner.

VIS – SciVis paper ‘PelVis: Atlas-based Surgical Planning for Oncological Pelvic Surgery’ accepted!

Our paper ‘PelVis: Atlas-based Surgical Planning for Oncological Pelvic Surgery’ was accepted for presentation at our largest conference, VIS (and publication in IEEE Transactions on Visualization and Computer Graphics)!

Abstract: Due to the intricate relationship between the pelvic organs and vital structures, such as vessels and nerves, pelvic anatomy is often considered to be complex to comprehend. In oncological pelvic surgery, a trade-off has to be made between complete tumor resection and preserving function by preventing damage to the nerves. Damage to the autonomic nerves causes undesirable post-operative side-effects such as fecal and urinal incontinence, as well as sexual dysfunction in up to 80 percent of the cases. Since these autonomic nerves are not visible in pre-operative MRI scans or during surgery, avoiding nerve damage during such a surgical procedure becomes challenging.

In this work, we present visualization methods to represent context, target, and risk structures for surgical planning. We employ distance-based and occlusion management techniques in an atlas-based surgical planning tool for oncological pelvic surgery. Patient-specific pre-operative MRI scans are registered to an atlas model that includes nerve information. Through several interactive linked views, the spatial relationships and distances between the organs, tumor and risk zones are visualized to improve understanding, while avoiding occlusion. In this way, the surgeon can examine surgically relevant structures and plan the procedure before going into the operating theater, thus raising awareness of the autonomic nerve zone regions and potentially reducing post-operative complications. Furthermore, we present the results of a domain expert evaluation with surgical oncologists that demonstrates the advantages of our approach.

EuroVis short paper ‘VarVis: Visualizing Anatomical Variation in Branching Structures’ accepted!

The thrice rejected, thrice cursed work on visualizing anatomical variations in branching structures has been accepted as a short paper at EuroVis 2016! This means I can finally show you a video of the work without jeopardizing the double-blind review process:

Abstract: Anatomical variations are naturally-occurring deviations from typical human anatomy. While these variations are considered normal and non-pathological, they are still of interest in clinical practice for medical specialists such as radiologists and transplantation surgeons. The complex variations in branching structures, for instance in arteries or nerves, are currently visualized side-by-side in illustrations or expressed using plain text in medical publications.
In this work, we present a novel way of visualizing anatomical variations in complex branching structures for educational purposes: VarVis. VarVis consists of several linked views that reveal global and local similarities and differences in the variations. We propose a novel graph representation to provide an overview of the topological changes. Our solution involves a topological similarity measure, which allows the user to select variations at a global level based on their degree of similarity. After a selection is made, local topological differences can be interactively explored using illustrations and topology graphs. We also incorporate additional information regarding the probability of the various cases. Our solution has several advantages over traditional approaches, which we demonstrate in an evaluation.

The other short paper that was accepted is now on the EuroGraphics 2016 conference program, so I guess it is all official now. With all these short papers going around, I somehow keep getting reminded of the Simpsons and a certain phrase more specifically:

We should to get the STAR notification tomorrow, so hope to come back with more good news 🙂

EuroGraphics Education paper ‘The Online Anatomical Human: Web-based Anatomy Education’ accepted!

So last, well, let’s go with week, I hinted at a notification for a submitted EuroGraphics Education paper. I got said notification last week already, but was too busy with the EuroVis (EuroEverything!) Short Paper deadline to post about it.

As there is some sort of spoiler already in the title, it is probably not so surprising anymore, but there is an unexpected twist ;)… Our EuroGraphics 2016 Education paper on ‘The Online Anatomical Human: Web-based Anatomy Education’ was accepted, as a, drumroll please, short paper! Since I’m in my shortening-8-page-papers-to-half-their-size-mode (see also above: EuroVis Short Paper) anyway, good timing I guess 🙂

I updated the demo video with the latest version of the OAH, which now features textures and will soon be deployed in an upcoming Coursera MOOC on Anatomy of the Abdomen and Pelvis:

That’s all from the reigning Queen of Short Papers for now. My next double notification date is on March 18th, for the EuroVis STAR and Short Paper.

VCBM paper ‘Illustrative Multi-volume Rendering for PET/CT Scans’ accepted!

Our full paper on Illustrative Multi-volume Rendering for PET/CT Scans[1] was accepted for presentation at the always awesome VCBM workshop. I will be presenting it in Chester (UK) in September. For now, a teaser image of our technique:

lasmprvi_vcbm2015
Illustrative Multi-volume Rendering for PET/CT Scans teaser image

New publication: Lymphatic drainage pathways from the cervix uteri

In a previous post, I mentioned I made a 3D interactive pdf for a medical publication. This paper was recently accepted at the Gynecologic Oncology journal and it is now available online: Lymphatic drainage pathways from the cervix uteri; implications for radical hysterectomy? I’ll try and do a little ‘Science in plain English’, for those interested but not all that familiar with the medical jargon.

A hysterectomy is a surgical treatment for early-stage cervical cancer where the womb is taken out. Typically also part of the lymphatic system in the region is removed to prevent the cancer from spreading. There are different types of hysterectomies that vary by how much tissue is taken out:

New Publication: ”Toward a highly-detailed 3D pelvic model” and Google Scholar Citations

I love the smell of new publications in the morning! This particular morning I woke up to a nice little e-mail from Google Scholar entitled ‘Review updates to your Google Scholar profile’. It featured a brand new publication for me to approve and to add to my Google Scholar profile:

  • Toward a highly-detailed 3D pelvic model: Approaching an ultra-specific level for surgical simulation and anatomical education. A.C. Kraima, N.N. Smit, D. Jansma, C. Wallner, R.L.A.W. Bleys, C.J.H. v.d. Velde, C.P. Botha, M.C. Deruiter, Clinical Anatomy, December 2012

A look back on 2012

As is traditional in this time of year, I thought it would be nice to summarize some of the highlights in my professional life of 2012. The year started well enough, I was working on my master thesis (The Unified Anatomical Human) and finally graduated in March obtaining my degree in Computer Science – Media and Knowledge Engineering.

At the graduation ceremony with Professor Jansen