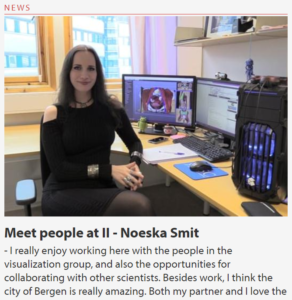
I’m going to go ahead and resist the urge to write about how I did not write for a while. Does this mean I just did? Anyway, I was recently interviewed by Pina Kingman and Eli Ertresvaag for the webpage of the Department of Informatics at the University of Bergen. I think I look super-tense, which is quite amazing considering this is my third video interview already 🙂 Also, it is quite noticeable in the written text that I don’t speak to 10-year-olds on the regular!
The last day of the year is upon us, so it’s just about time for a review of 2016 and to look forward to 2017! I really enjoyed writing a similar post last year, looking back at last year and looking forward to next year, so this means you get to suffer through another one of them :). Again, first of all, my best wishes to all of you for 2017! I hope you have an amazing year with lot of awesomeness all around.
Let’s get down to review business, starting with the looking back part:
Again, I didn’t blog so much, and I really hope to do more next year. I have a long to-do list especially for medvis.org, so I really want to get back into it soon. For personal reasons (still the same ones as last year), I am making this personal blog a bit less personal, and a bit more work-related. I am especially inspired currently by Veronika’s awesome (and frequent) blogposts to start writing more again myself 🙂
I guess one of the major events last year for me personally was my PhD defense. I wrote about it before, so won’t go into too much detail here. I am looking back still on a really cool day with a lot of cool people, and still very thankful to all those people that made this possible for me.
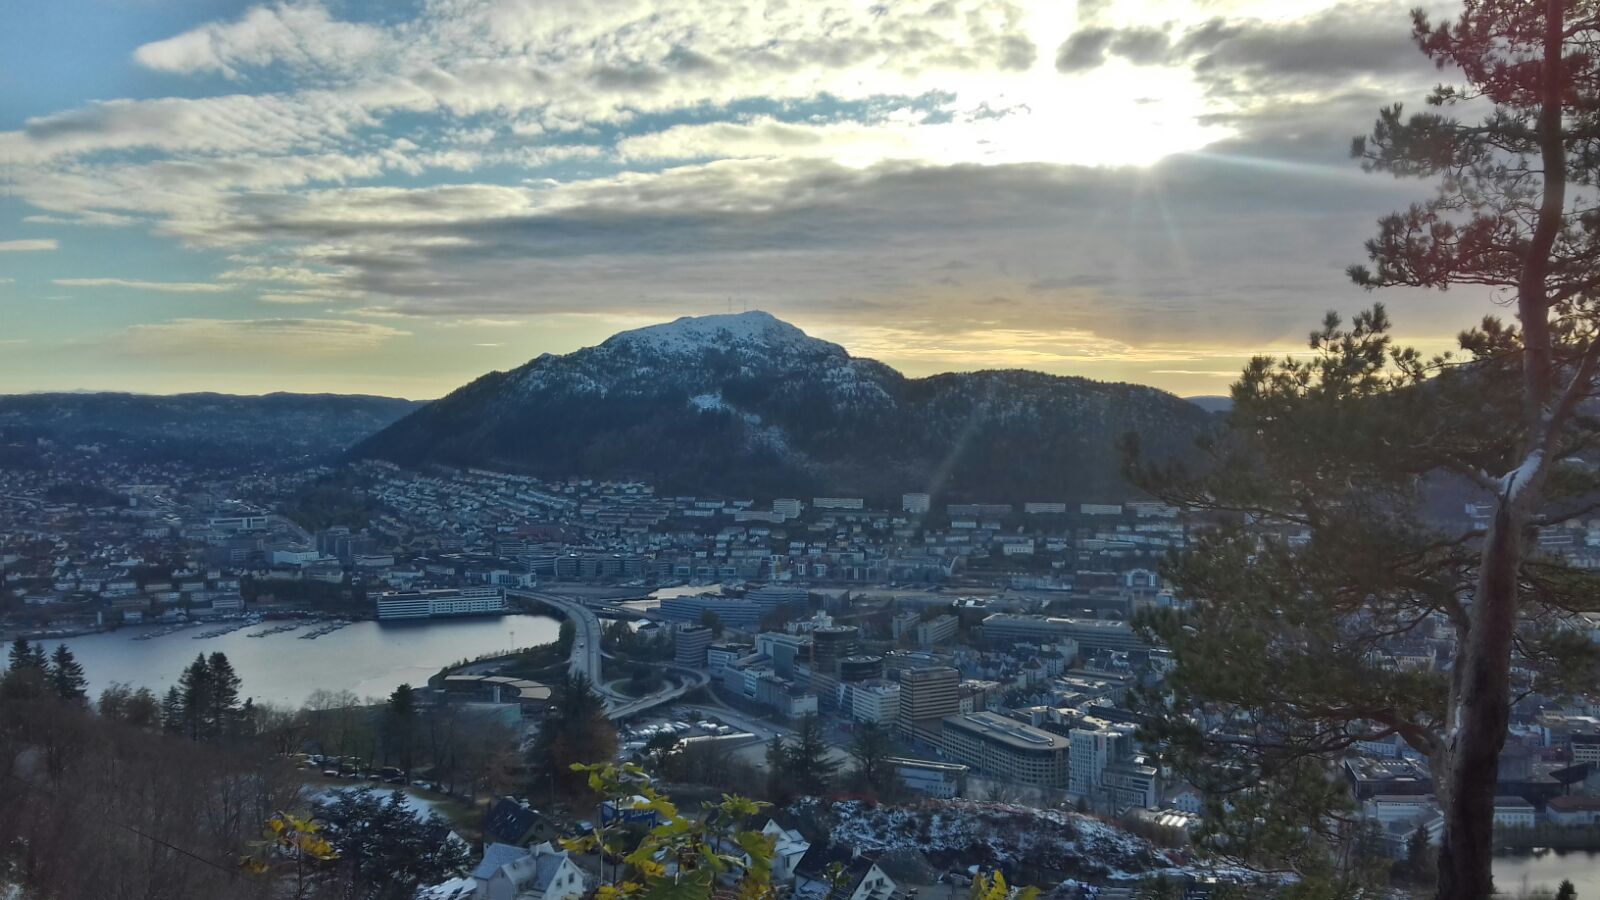
The other major event was moving to a new job and a new country. While last year, at the time of writing my review post, I had no idea this would actually be happening, I accepted a position as a researcher here in the Bergen, Norway, at the visualization group in the department of informatics from the 1st of August. A nice contrast from last year’s review: “I could definitely see that becoming sort of just a thing to do on the weekends while living there” vs. now: “Walking up mountains in the weekend, waddup!”:
View from Fløyen on a nice Søndagstur
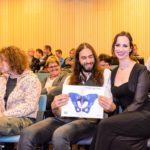
I really enjoyed last year ‘academically’, as I got to enjoy a lot of my favorite activties: cool collaborations, paper writing, and attending conferences. I presented papers at Eurographics, EuroVis, VIS, and attended VCBM, co-authoring a paper there too and winning a MedViz image award. I still also have two journal papers under revision, and I find I enjoy these less than conference papers, mainly because they have been dragging on over longer periods of time. Besides, the papers in our field in top conferences end up in journals anyway, and then you get to meet cool people at conferences as an added bonus. This could lead to new collaborations, which in turn could lead to new conference papers, and more conference attending 🙂 Yea, more of my favorite things!
As for looking forward, all three wishes I made last year for this year (more collaborations, wrapping up papers, getting doctorified + starting something new) came true, so fingers crossed for 2017’s plans as well:
First some news: from the 1st of January 2017, I’ll be working as an associate professor (tenure-track) in medical visualization at the Bergen visualization group. I am far beyond excited about this: the research environment and opportunities for true interdisciplinairy medvis collaborations here are incredible, so I am thankful for this amazing opportunity. Therefore, in 2017 and the coming years, I hope to further develop and establish my research agenda, perhaps moving away a bit from the pelvic area, and into new and exciting challenges.
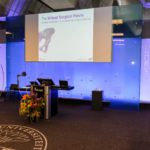
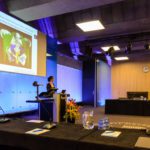
In May, I am giving an invited talk together with Annelot Kraima at the annual national symposium for surgical assistants. Really excited to present our joint work including PelVis there for a new audience.
In 2017, I’ll also be co-chairing the EuroRV³ workshop, which is co-located with EuroVis 2017 in Barcelona (so much co- going on there! I also hope it will be co-ol ;)). The theme of this international EuroVis Workshop on Reproducibility, Verification, and Validation in Visualization will be “Perception in Visualization”, and we will be releasing a call for contributions soon :).
Finally, for 2017 besides continuing the things I’m already enjoying, I’m looking forward to new experiences and learning new skills. For instance, I am working on a project proposal currently, and will be teaching as well. I am also learning the Norwegian language, both via Duolingo as via a ‘real course’. Exciting times ahead!
That about wraps it up! I noticed compared to last year’s plans for next year, I now have more concrete plans lined up for next year already, and I consider this a good thing :). I hope this will help with focus and productivity in 2017. Again, all the best to all my (lol) dear blog readers: gott nytt år!
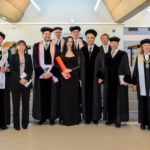
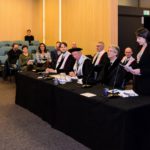
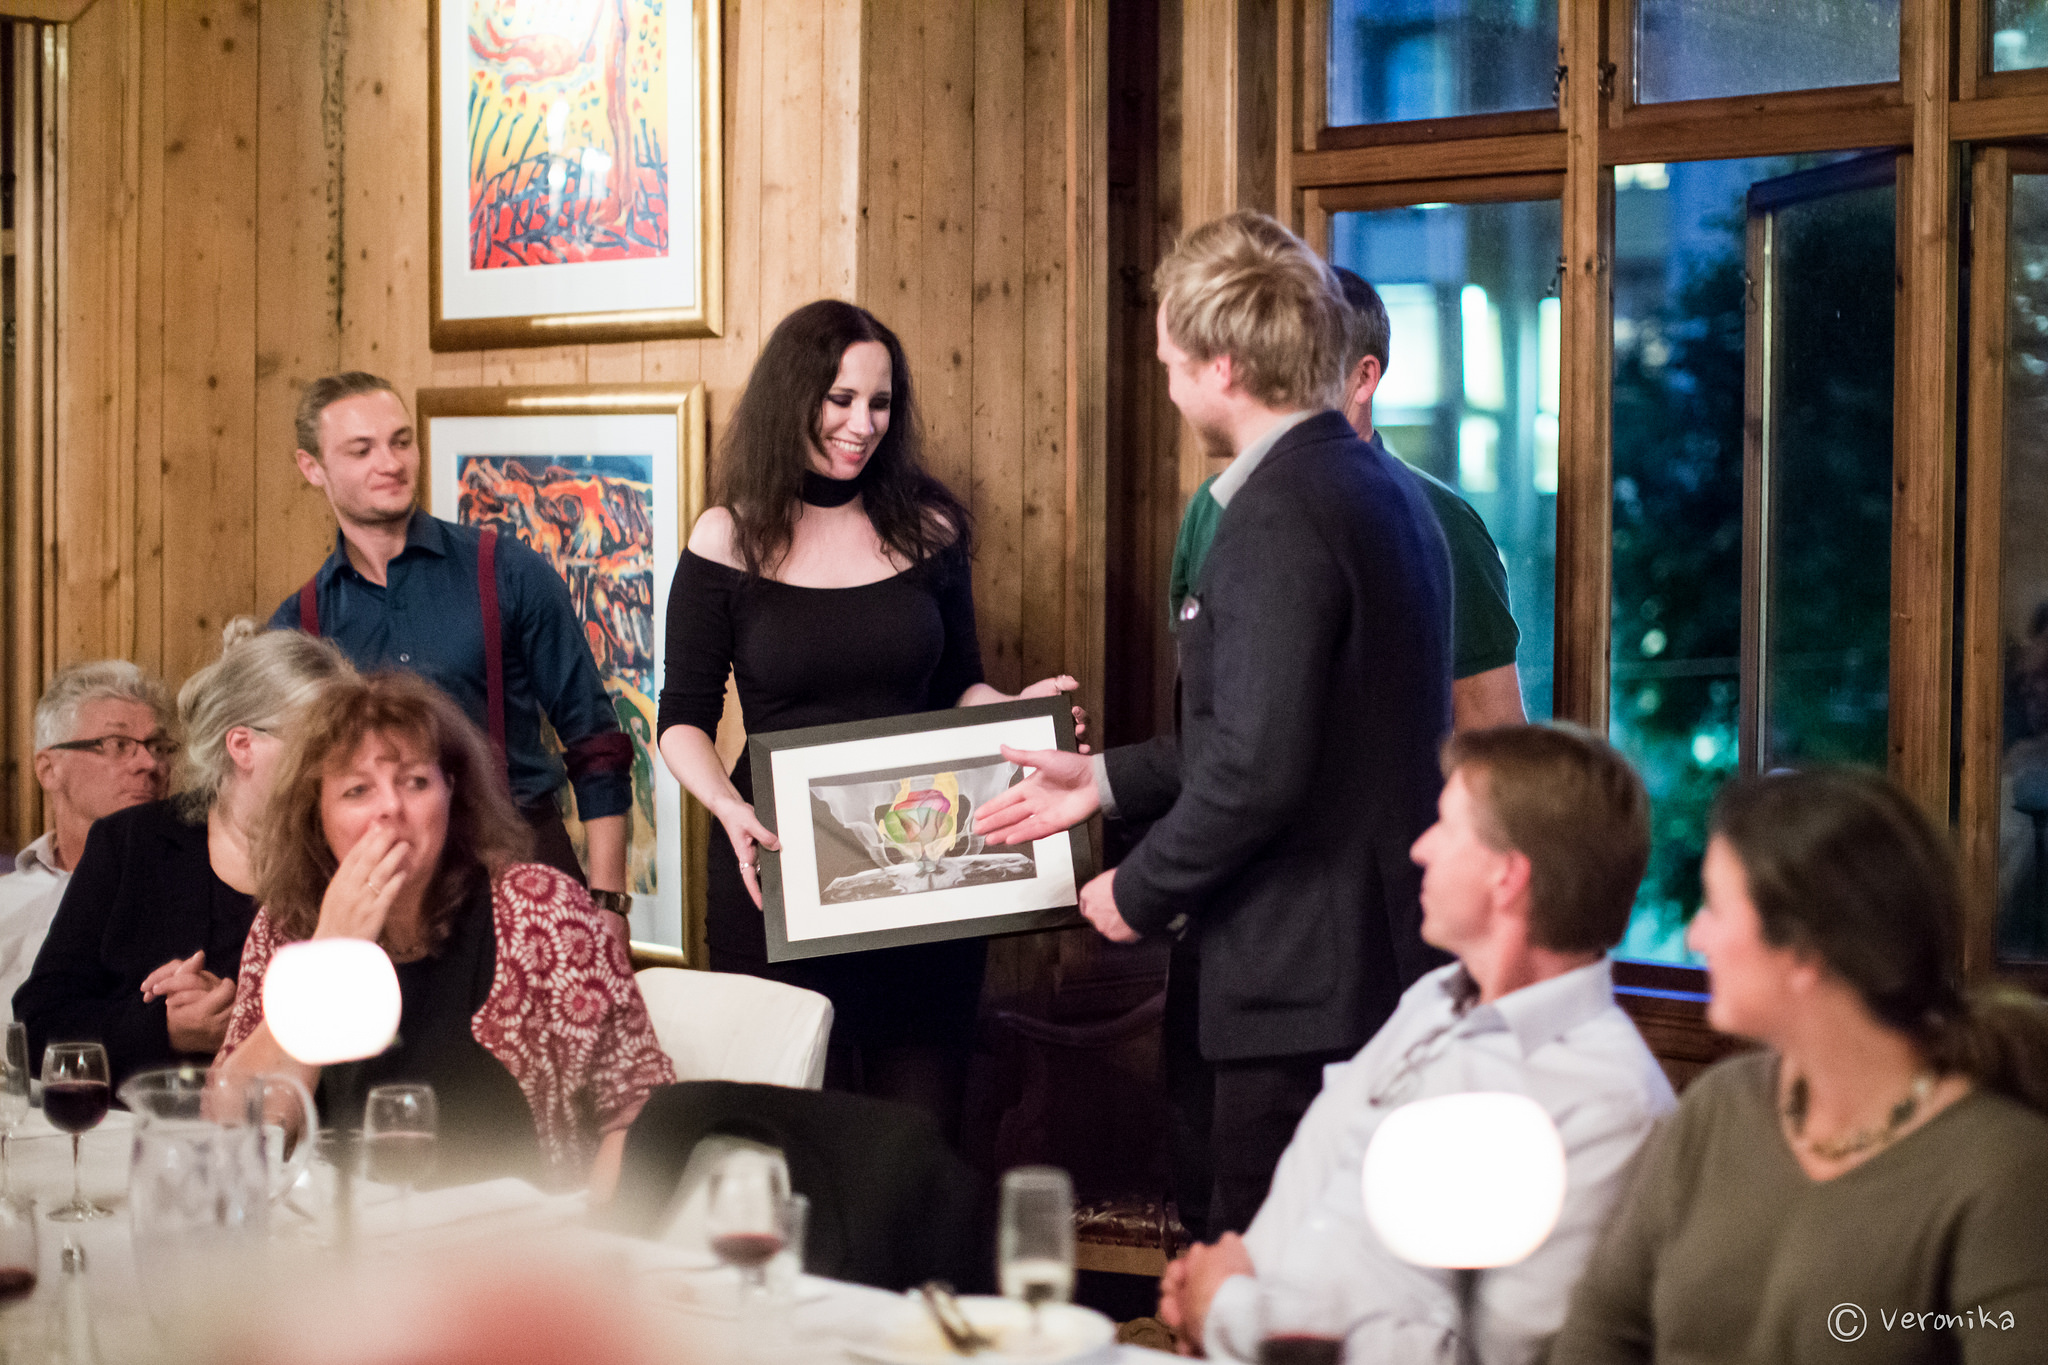
On the 31st of October, yes that’s Halloween, I successfully defended my PhD thesis/got doctorified. After presenting PelVis at IEEE VIS in Baltimore, I flew straight back to the Netherlands for this special occassion. Jetlag notwithstanding, I did manage to answer one hour’s worth of questions and can now officially call myself doctor (not that I would ^^). I’ve got some pictures for you, my faithful blog readers, of course, taken by my brother and official event photographer Joeri Smit:
The venue: Senaatszaal at the TU Delft Aula.
During the “Lekenpraatje” an informal presentation for friends and family.
Gerrit showing off the brilliant thesis cover design he made (rendering was done in Volumeshop).
Posing with the defense committee. Contrary to popular belief, this is not a giant firework, but in fact my degree.
Moments after getting doctorified, enjoying a great speech by Anna Vilanova and Charl Botha
I made a special page for my thesis, with some more details and a download link to the pdf version here. I had an amazing day, and would like to thank all those involved for this (read the Acknowledgments chapter in my thesis for a more wordy thank you ;)).
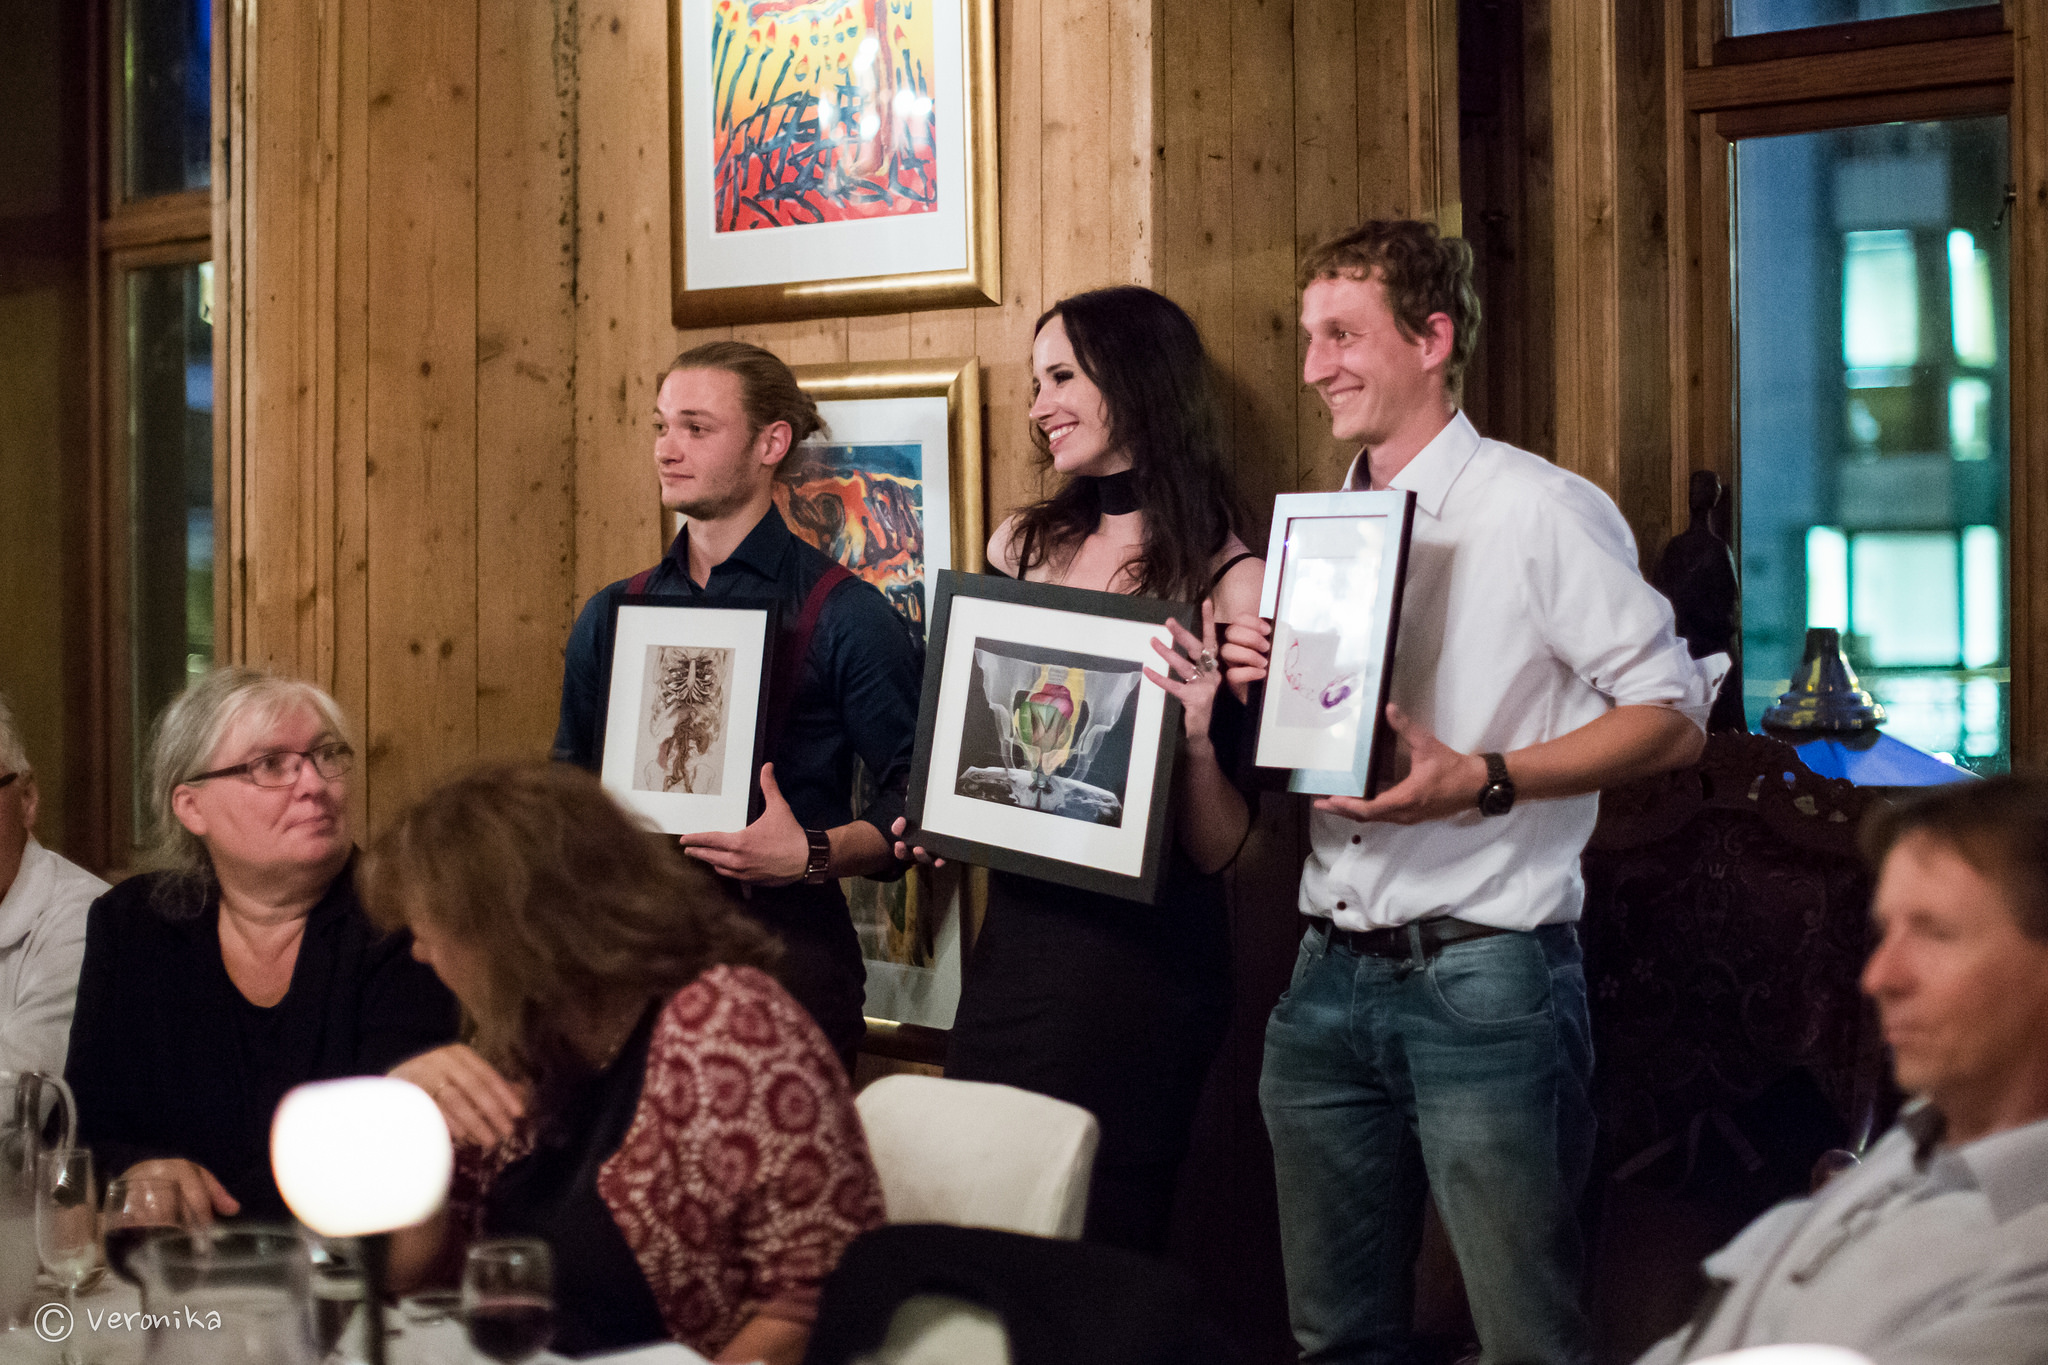
There were three winners in this image contest, and besides our pelvis, also Sergej Stoppel and Niels de Hoon received a prize, with their works entitled ‘Arteries in focus’ and ‘Turbulent flow in an aorta’, respectively:
MedViz image contest 2016 winners
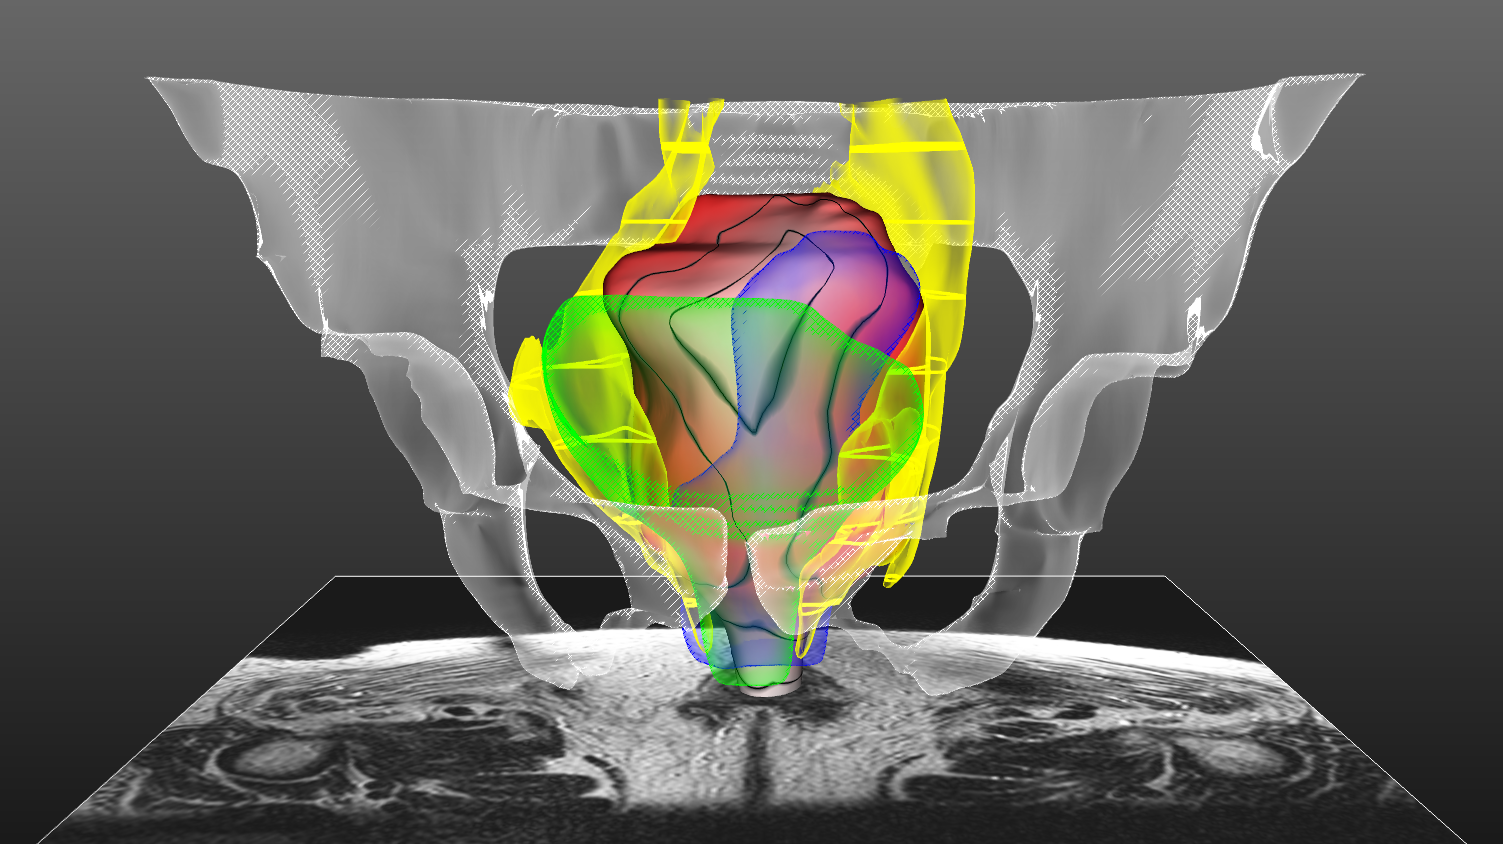
I sent in the following submission:
PelVis
Authors
Noeska Smit, Kai Lawonn, Annelot Kraima, Marco de Ruiter, Hessam Sokooti, Stefan Bruckner, Elmar Eisemann, Anna Vilanova
Short Description
This image depicts PelVis [1], an interactive application for surgical planning for the Total Mesorectal Excision (TME) procedure. During this surgical procedure, undesired side-effects occur in up to 80% of the cases due to damage to the autonomic nerves. These nerves are damaged easily, since they are not visible in pre-operative MRI or even during the surgery. In order to visualize these nerves, we built an atlas model, the Virtual Surgical Pelvis (VSP) [1], that reveals zones in which the autonomic nerves reside based on cryosection and immunohistochemical studies. In the PelVis application, we register this atlas to patient-specific clinical MRI data and thus are able to make patient-specific virtual models of the individual patient, and to reveal the autonomic nerve zones pre-operatively, as displayed here in yellow. We highlight the distance of the mesorectal wall to these nerve zones using a colormap (red to white) combined with isolines. Furthermore, other surgically relevant anatomy is shown for spatial context, without occluding the view on the mesorectum, and the linked atlas-enriched MRI data can be explored interactively [3].
[1]: Smit, N., Lawonn, K., Kraima, A., DeRuiter, M., Sokooti, H., Bruckner, S., … & Vilanova, A. PelVis: Atlas-based Surgical Planning for Oncological Pelvic Surgery. (2017) IEEE Transactions on Visualization & Computer Graphics, (1), 1-1. Accepted, to appear.
[2]: Kraima, A., Smit, N. N., Jansma, D., West, N. P., Quirke, P., Rutten, H. J., … & DeRuiter, M. C. (2014). 62. The virtual surgical pelvis: A highly-detailed 3D pelvic model for anatomical education and surgical simulation. European Journal of Surgical Oncology, 40(11), S32.
Our paper ‘ Sline: Seamless Line Illustration for Interactive Biomedical Visualization’ was accepted for presentation at VCBM 2016, the 6th Eurographics Workshop on Visual Computing for Biology and Medicine. I’ve attended all VCBM editions since 2012, and am happy I can attend this one as well in Bergen, Norway. Which is extra convenient, since it’s my new hometown! I accepted a position as a researcher in the amazing visualization group at the University of Bergen and just started this week ^^
Back to Sline though, it’s a cool technique where you can pick an illustrative rendering style per structure using a single parameter slider. Behold:
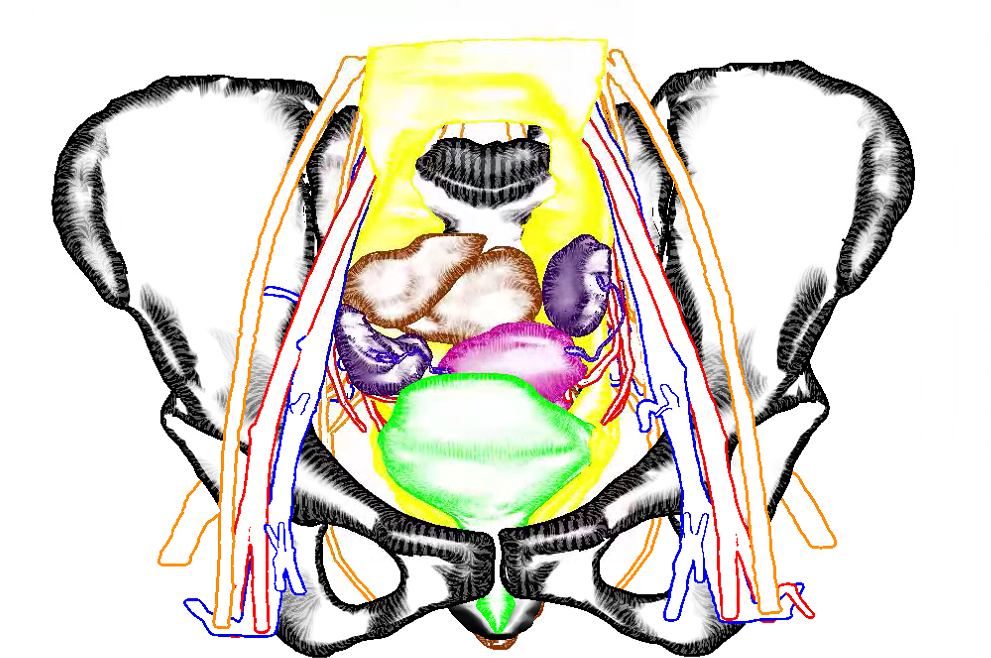
Our Virtual Surgical Pelvis illustrated using Sline. So the organs and bones are hatched to draw attention here, while the nerves and vessels are de-emphasized by rendering only the silhouettes.
abstract: In medical visualization of surface information, problems often arise when visualizing several overlapping structures simultaneously. There is a trade-off between visualizing multiple structures in a detailed way and limiting visual clutter, in order to allow users to focus on the main structures. Illustrative visualization techniques can help alleviate these problems by defining a level of abstraction per structure. However, clinical uptake of these advanced visualization techniques so far has been limited due to the complex parameter settings required.
To bring advanced medical visualization closer to clinical application, we propose a novel illustrative technique that offers a seamless transition between various levels of abstraction and detail. Using a single comprehensive parameter, users are able to quickly define a visual representation per structure that fits the visualization requirements for focus and context structures. This technique can be applied to any biomedical context in which multiple surfaces are routinely visualized, such as neurosurgery, radiotherapy planning or drug design. Additionally, we introduce a novel hatching technique, that runs in real-time and does not require texture coordinates. An informal evaluation with experts from different biomedical domains reveals that our technique allows users to design focus-and-context visualizations in a fast and intuitive manner.
Our paper ‘PelVis: Atlas-based Surgical Planning for Oncological Pelvic Surgery’ was accepted for presentation at our largest conference, VIS (and publication in IEEE Transactions on Visualization and Computer Graphics)!
Abstract: Due to the intricate relationship between the pelvic organs and vital structures, such as vessels and nerves, pelvic anatomy is often considered to be complex to comprehend. In oncological pelvic surgery, a trade-off has to be made between complete tumor resection and preserving function by preventing damage to the nerves. Damage to the autonomic nerves causes undesirable post-operative side-effects such as fecal and urinal incontinence, as well as sexual dysfunction in up to 80 percent of the cases. Since these autonomic nerves are not visible in pre-operative MRI scans or during surgery, avoiding nerve damage during such a surgical procedure becomes challenging.
In this work, we present visualization methods to represent context, target, and risk structures for surgical planning. We employ distance-based and occlusion management techniques in an atlas-based surgical planning tool for oncological pelvic surgery. Patient-specific pre-operative MRI scans are registered to an atlas model that includes nerve information. Through several interactive linked views, the spatial relationships and distances between the organs, tumor and risk zones are visualized to improve understanding, while avoiding occlusion. In this way, the surgeon can examine surgically relevant structures and plan the procedure before going into the operating theater, thus raising awareness of the autonomic nerve zone regions and potentially reducing post-operative complications. Furthermore, we present the results of a domain expert evaluation with surgical oncologists that demonstrates the advantages of our approach.
I recently mentioned a certain OAH webviewer short paper that was accepted as a EuroGraphics Education paper, but I now have some more news to share: the webviewer will be used in a Coursera course on anatomy of the abdomen and pelvis that starts this week, entitled ‘Anatomy of the Abdomen and Pelvis; a journey from basis to clinic.’! This course is a Massive Open Online Course (MOOC), a free online course aimed at unlimited participation, and organized by highly qualified people at the Leiden University Medical Center.
So far, already 7,796 people signed up. If you also have an interest in anatomy, why not sign up yourself? It’s completely free and completely awesome, I promise! I do have to add, it is not for the faint of heart, since it features live anatomical dissection videos. I am following the course myself and really enjoying the classes. I even just passed my first quiz with 100% correct answers. Try and beat that 😉
Soon, you could be playing around with this yourself:
Looking forward to seeing you as my virtual classmates in the course 🙂
So until last year, I never worked with shaders in VTK (the Visualization Toolkit). This was kind of sad actually, but I thought it would be super difficult, the need didn’t really arise and well, ain’t nobody got time for that! For our VIS 2016 submission though, I finally got to play around with them. And spoiler alert: it’s not that difficult and even kind of fun! Especially with a little help from highly intelligent co-authors 🙂
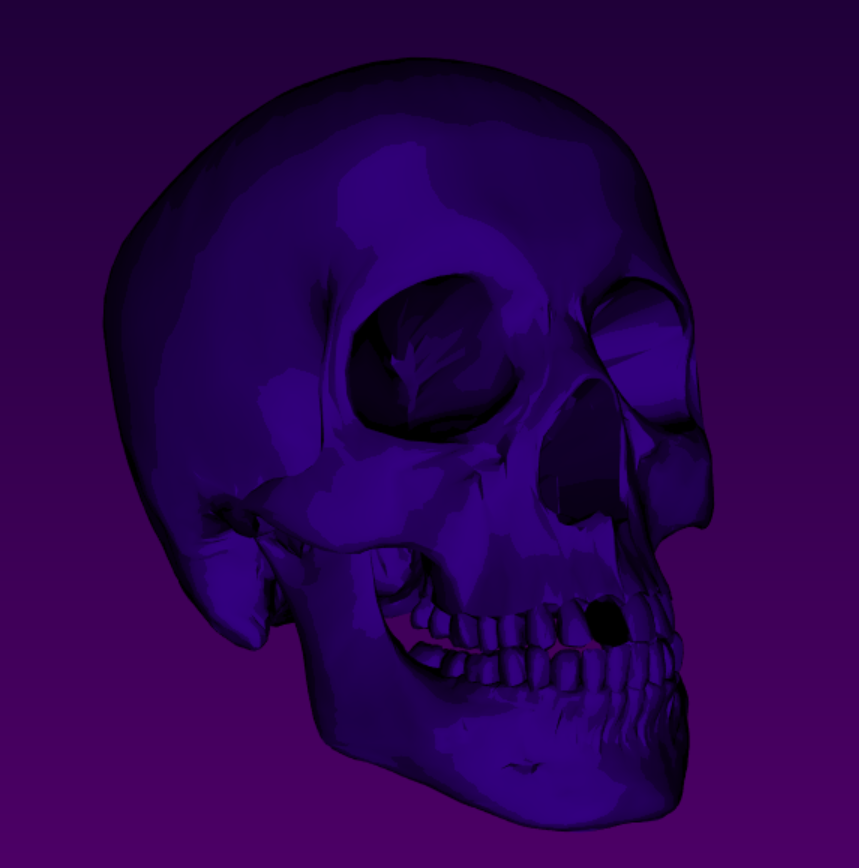
So today I would like to share a little Python example I made as a tutorial, featuring a cel-shaded (or toon-shaded if you’re one of those people) donut or skull in exactly 100 lines of code, probably half of them comments. Before we get started, a little sneak preview:
Cel-shaded SkullCel-shaded Donut
Right, so let’s get started! I’m using VTK version 6.3 built with the ‘old’ OpenGL backend and not the newer OpenGL2 one, in which custom shaders are handled in a different way. I’m using 64-bit Python 2.7 to go with this. You can find the skull surface and code you need here: shaderfun.
VTK supports GLSL shaders that you can add to your vtkActors. The easiest way to do this is, in my opinion, by specifying your shaders as multi-line strings using triple quote block (”’ bla ”’ or “”” bla “””). You can define a vertex and fragment shader in this way. To get your shader to work with VTK, you need to define a propFuncVS in the vertex shader, and a propFuncFS function in the fragment shader. These are the ones we’re using today:
The vertex shader:
vert = """
    varying vec3 n;
    varying vec3 l;

    void propFuncVS(void)
    {
        n = normalize(gl_Normal);
        l = vec3(gl_ModelViewMatrix * vec4(n,0));
        gl_Position = gl_ModelViewProjectionMatrix * gl_Vertex;
    }
"""
Once you made some shaders, you want to add them to your vtkActor so that VTK knows which objects to shade. First you make a vtkShaderProgram2 and set its context to your render window. Then you make a vtkShader2 for every shader you made, e.g., one for the vertex shader and one for the fragment shader, set the source codes to your multiline GLSL strings. and set their context to that of the vtkShaderProgram2. Now you can add the shaders to the program. You get the OpenGL property of your actor and call SetPropProgram to attach your shader program to the actor. Finally, just set the Shading to On of your property and you are good to go! Did I make it sound difficult? It’s not, here’s the relevant code:
# Now let's get down to shader-business...
# First we make a ShaderProgram2 and set it up on a date with the RenderWindow
pgm = vtk.vtkShaderProgram2()
pgm.SetContext(renWin)

# For both the vertex and fragment shader, we need to make a Shader2
# Also set them up with the RenderWindow, by asking the ShaderProgram2 for an introduction
shaderv = vtk.vtkShader2()
shaderv.SetType(vtk.VTK_SHADER_TYPE_VERTEX)
shaderv.SetSourceCode(vert)
shaderv.SetContext(pgm.GetContext())
shaderf = vtk.vtkShader2()
shaderf.SetType(vtk.VTK_SHADER_TYPE_FRAGMENT)
shaderf.SetSourceCode(frag)
shaderf.SetContext(pgm.GetContext())

# Now we add the shaders to the program
pgm.GetShaders().AddItem(shaderv)
pgm.GetShaders().AddItem(shaderf)

# And tell the actor property that it should totally use this cool program
openGLproperty = actor.GetProperty()
openGLproperty.SetPropProgram(pgm)
openGLproperty.ShadingOn()
That’s it for my basic tutorial on how to use shaders in VTK. If people are interested, I could make a more elaborate tutorial on how to pass attributes, use textures, and scalar mesh properties in your VTK shaders 🙂 Hope this was helpful!
The thrice rejected, thrice cursed work on visualizing anatomical variations in branching structures has been accepted as a short paper at EuroVis 2016! This means I can finally show you a video of the work without jeopardizing the double-blind review process:
Abstract: Anatomical variations are naturally-occurring deviations from typical human anatomy. While these variations are considered normal and non-pathological, they are still of interest in clinical practice for medical specialists such as radiologists and transplantation surgeons. The complex variations in branching structures, for instance in arteries or nerves, are currently visualized side-by-side in illustrations or expressed using plain text in medical publications.
In this work, we present a novel way of visualizing anatomical variations in complex branching structures for educational purposes: VarVis. VarVis consists of several linked views that reveal global and local similarities and differences in the variations. We propose a novel graph representation to provide an overview of the topological changes. Our solution involves a topological similarity measure, which allows the user to select variations at a global level based on their degree of similarity. After a selection is made, local topological differences can be interactively explored using illustrations and topology graphs. We also incorporate additional information regarding the probability of the various cases. Our solution has several advantages over traditional approaches, which we demonstrate in an evaluation.